
Chemistry, 25.05.2021 14:00 LoserMcBadface
11. (07.05 MC)
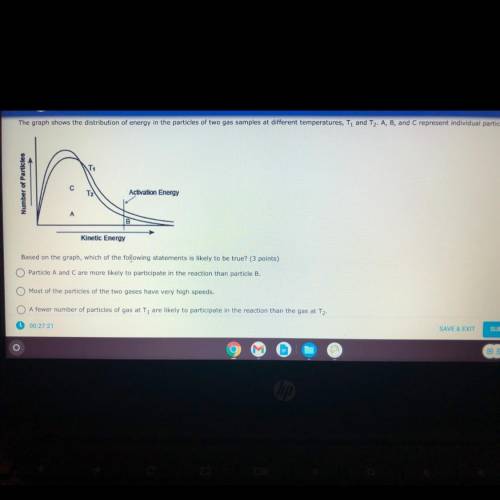
The graph shows the distribution of energy in the particles of two gas samples at different temperatures, T, and Tz. A, B, and C represent individual particles.
Number of Particles
Activation Energy
А
Kinetic Energy
Based on the graph, which of the following statements is likely to be true? (3 points)

Answers: 1


Other questions on the subject: Chemistry
Chemistry, 21.06.2019 22:30, bartfrank447
Joseph has hypothesized that sound travels in waves. if he were following the scientific method, what should he do next? a. ask a question. b. test the hypothesis. c. study the results. d. tell other scientists about his hypothesis.
Answers: 1
You know the right answer?
11. (07.05 MC)
The graph shows the distribution of energy in the particles of two gas samples at di...
Questions in other subjects:

Social Studies, 15.07.2019 03:00


Biology, 15.07.2019 03:00
Mathematics, 15.07.2019 03:00


