
PLEASE HELP!
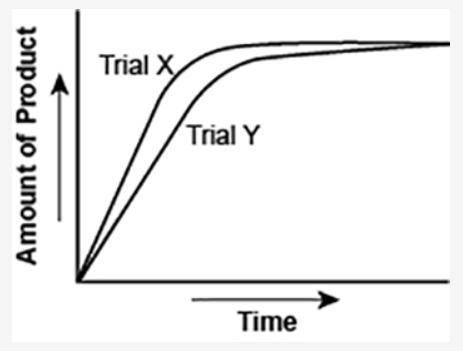
The graph shows the volume of a gaseous product formed during two trials of a reaction. A different concentration of reactant was used during each trial, whereas the other factors were kept constant.
(I've attached the graph.)
Which of the following statements explains which trial has a lower concentration of the reactant?
a. Trial X, because the final volume of product formed is lower than Trial Y.
b. Trial X, because this reaction was initially fast and later stopped completely.
c. Trial Y, because the reaction was initially slow and later stopped completely.
d. Trial Y, because the volume of product formed per unit time is lower than Trial X.

Answers: 3


Other questions on the subject: Chemistry
Chemistry, 22.06.2019 05:30, tifftiff22
Arecipe calls for 1.2 cups of oil. how many liters of oil is this?
Answers: 2
Chemistry, 22.06.2019 16:50, brandiwingard
What is conserved in the reaction shown below? h2(g) + cl2 (g) --> 2hcl(g)a. mass onlyb. mass and moles onlyc. mass, moles, and molecules onlyd. mass, moles, molecules, and volume
Answers: 2
You know the right answer?
PLEASE HELP!
The graph shows the volume of a gaseous product formed during two trials of a reaction...
Questions in other subjects:

Arts, 14.04.2020 21:08

History, 14.04.2020 21:08


Social Studies, 14.04.2020 21:08


History, 14.04.2020 21:08


