
Chemistry, 27.04.2021 01:00 angellll4455
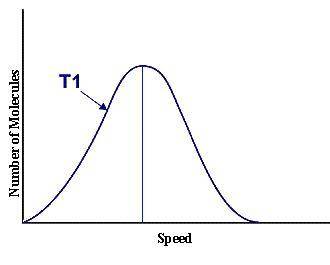
This graph represents a population of molecules in a gas versus the distribution of the average velocity(speed) of its molecules in that population. Assume all molecules to be of the same mass. In reading the graph, it is important to note three things. One, is the most probable speed is at the peak of the curve. Secondly, the most probable speed increases as the temperature increases (so shift to the right), and the distribution broadens as it increases.
On the graph, indicate the average kinetic energy of the population.
Explain your answer.
What part of the graph indicates the temperature of the sample?
Explain your answer.
Print out graph paper (click here for graph paper) and sketch a curve that represents the distribution of molecules at a temperature below the one shown. Label it as T2. Describe both T and T2 in terms of their average kinetic energy. Be specific and detailed.

Answers: 1


Other questions on the subject: Chemistry
Chemistry, 22.06.2019 04:00, miamassimino
The rules of engagement (roe) working group is often used to (select all that apply.)
Answers: 2
Chemistry, 22.06.2019 05:50, carog24
Astudent made a graph plotting the progress of a reaction over time. the student forgot to label the y-axis of the graph. a graph is shown with two graph lines. one graph line starts at a higher position on the y axis and slopes downwards towards the right. the other graph line starts at a lower position on the y axis and slopes upwards towards the right. the two graph lines stop short of intersecting each other and continue as separate lines which gradually become straight and parallel to the x axis. a vertical line is shown at a point where the two graph lines finally became parallel to the x axis. this vertical line is labeled equilibrium. the title on the x axis is time and an arrow pointing towards the right is shown above time. the title on the y axis is left blank. what best explains the label that the student should use on the y-axis? amount, because as the amount of product decreases, the amount of reactant increases over time. reaction rate, because forward and backward reaction become equal at equilibrium. amount, because the amounts of reactants and products become constant after equilibrium is reached. reaction rate, as the rate of forward reaction increases and rate of backward reaction decreases over time.
Answers: 3
You know the right answer?
This graph represents a population of molecules in a gas versus the distribution of the average velo...
Questions in other subjects:

History, 31.07.2019 09:00


Social Studies, 31.07.2019 09:00
Mathematics, 31.07.2019 09:00


