
Chemistry, 22.04.2021 14:00 NeverEndingCycle
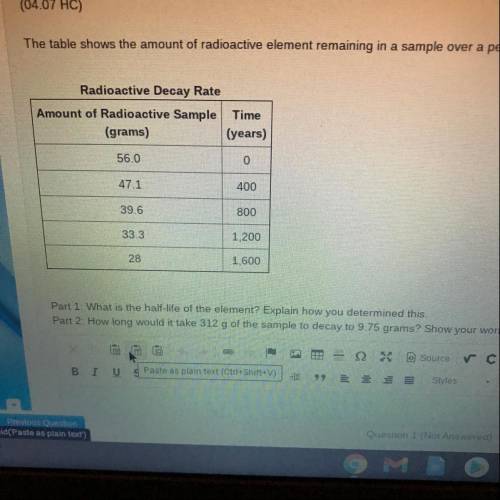
The table shows the amount of radioactive element remaining in a sample over a period of time.
Radioactive Decay Rate
Amount of Radioactive Sample Time
(grams)
(years)
Part 1. What is the half-life of the element? Explain how you determined this.
Part 2: How long would it take 312 g of the sample to decay to 9.75 grams? Show your work or explain your answer

Answers: 2


Other questions on the subject: Chemistry
Chemistry, 22.06.2019 01:00, bettybales1986
According to the tide table below what time of day will the highest tide occur?
Answers: 1
Chemistry, 22.06.2019 03:10, lilque6112
Between 2014 and 2016, more than 25,000 children in flint, michigan, drank water that was contaminated with lead from lead pipes. during this time, the city claimed the water was safe to drink. which of these actions could the city have taken to ensure that the drinking water was free from lead?
Answers: 3
Chemistry, 22.06.2019 12:30, AlexRavenwood127
What metric units would you use to measure the thickness of a key
Answers: 3
Chemistry, 22.06.2019 16:00, winnie45
He table below gives the atomic mass and relative abundance values for the three isotopes of element m. relative abundance (%) atomic mass (amu) 78.99 23.9850 10.00 24.9858 11.01 25.9826 what is the average atomic mass (in amu) of element m? 2.86 5.36 24.30 24.98
Answers: 2
You know the right answer?
The table shows the amount of radioactive element remaining in a sample over a period of time.
Rad...
Questions in other subjects:


Spanish, 12.03.2020 21:29


Mathematics, 12.03.2020 21:29


