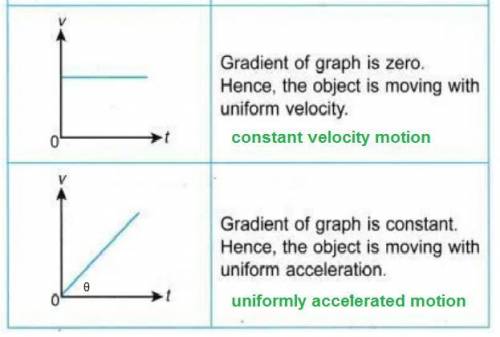
The velocity graph (v) with respect to time (t) (v on the y axis and t on the x axis) on :
constant velocity motion shows a straight line parallel to the x-axis (= time)
uniformly accelerated motion shows a sloping straight line with gradient tan θ = a
Further explanation
Linear motion consists of 2: constant velocity motion with constant velocity and uniformly accelerated motion with constant acceleration
At constant velocity motion:
the speed of vo = v = constant
acceleration = a = 0
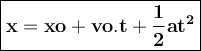
Δx = vt or x = xo + vt
An equation of constant velocity motion
x = distance = m
v = speed = m / s
t = time = seconds
The velocity graph (v) versus time (t) (v on the y axis and t on the x axis) shows a straight line parallel to the x axis (= time) because it has a constant speed
While the displacement of objects (Δx) is the area under the v-t line
An equation of uniformly accelerated motion
V = vo + at
Vt² = vo² + 2a (x-xo)
x = distance on t
vo/vi = initial speed
vt/vf = speed on t
/final speed
a = acceleration
Acceleration is a change in speed within a certain time interval
a = Δv /Δ t

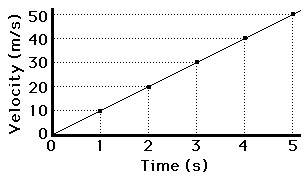
The velocity graph with respect to time (v-t) in this motion will be in the form of sloping straight lines with a gradient of tan θ= a
For acceleration that is positive (a> 0) called accelerated motion, the graph is sloping upward, while for acceleration that is negative (a <0) called slowed down motion , the graph is sloping downward
Learn more
The distance of the elevator
link
resultant velocity
link
the average velocity
link
Keywords: constant velocity motion, uniformly accelerated motion, v-t graph, distance, speed, acceleration, straight lines