
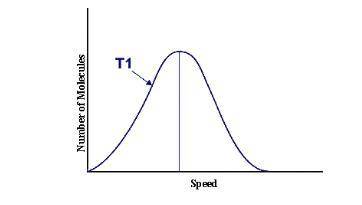
This graph represents a population of molecules in a gas versus the distribution of the average velocity(speed) of its molecules in that population. Assume all molecules to be of the same mass. In reading the graph, it is important to note three things. One, is the most probable speed is at the peak of the curve. Secondly, the most probable speed increases as the temperature increases (so shift to the right), and the distribution broadens as it increases.
On the graph, indicate the average kinetic energy of the population.
Explain your answer.
What part of the graph indicates the temperature of the sample?
Explain your answer.

Answers: 1


Other questions on the subject: Chemistry
Chemistry, 21.06.2019 20:00, Britny2386
2h2s + 3o2 2so2 + 2h2o which option gives the correct mole ratios? h2s: so2 = 2: 2 and o2: h2o = 3: 2 h2s: so2 = 2: 3 and o2: h2o = 3: 2 h2s: so2 = 4: 4 and o2: h2o = 5: 4 h2s: so2 = 4: 6 and o2: h2o = 4: 4
Answers: 1
Chemistry, 22.06.2019 09:50, bridgetosanders
What are four significant sources of ghgs that come from wostem washington?
Answers: 2
Chemistry, 23.06.2019 13:00, 4804344130
Aecosystem is if it can continue to function over long periods of time
Answers: 1
You know the right answer?
This graph represents a population of molecules in a gas versus the distribution of the average velo...
Questions in other subjects:

Mathematics, 07.09.2021 21:20


Mathematics, 07.09.2021 21:20


