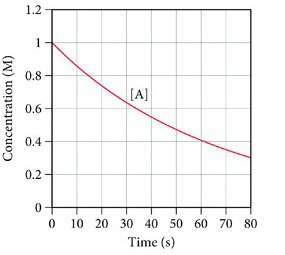
This graph shows the concentration of the reactant a in the reaction a→b.
determine the...

Chemistry, 28.10.2019 09:31 dorindaramirez0531
This graph shows the concentration of the reactant a in the reaction a→b.
determine the average rate of the reaction between 0 and 10 seconds.
0.007 m/s
0.014 m/s
0.86 m/s
0.07 m/s

Answers: 3


Other questions on the subject: Chemistry
Chemistry, 22.06.2019 01:40, natannale
Darla claims that the first periodic table developed by mendeleev was not completely accurate, so it is not useful at all. harmony argues that it establish the periodic table we use today, making it more credible. who is correct and why? darla is correct, because a model that has any mistakes should be thrown out. darla is correct, because a good model would not need to change. harmony is correct, because mendeleev’s model had all of the information correct in the first version. harmony is correct, because mendeleev’s model made predictions that came true.
Answers: 1
Chemistry, 22.06.2019 03:20, Richwave17
Which type of substance ionizes partially and gives off hydrogen ions when dissolved in water? a. strong acid b. strong base c. weak acid d. weak base
Answers: 1
You know the right answer?
Questions in other subjects:


Mathematics, 15.12.2020 19:20

English, 15.12.2020 19:20


Physics, 15.12.2020 19:20

History, 15.12.2020 19:20

Arts, 15.12.2020 19:20


