
The graph below shows a reaction to which a catalyst has been added. How would the graph be different if it showed the same reaction without a catalyst?
A. The width of region 2 would be smaller.
B. The difference in the heights of regions 1 and 3 would be larger.
C. The height of region 2 would be larger
D. The distance between regions 1 and 3 would be smaller
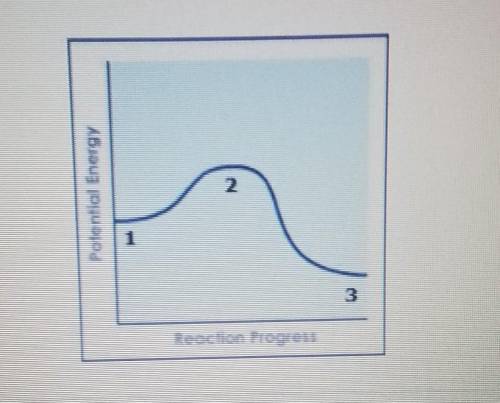

Answers: 3


Other questions on the subject: Chemistry
Chemistry, 22.06.2019 05:30, tifftiff22
Arecipe calls for 1.2 cups of oil. how many liters of oil is this?
Answers: 2
Chemistry, 22.06.2019 09:40, keiracoles
How many grams of aluminum will there be in 98g of al2o3?
Answers: 1
You know the right answer?
The graph below shows a reaction to which a catalyst has been added. How would the graph be differen...
Questions in other subjects:


History, 18.10.2019 13:30
Mathematics, 18.10.2019 13:30
History, 18.10.2019 13:30


