
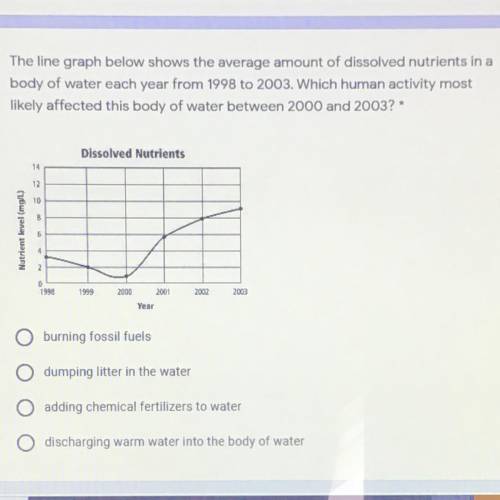
The line graph below shows the average amount of dissolved nutrients in a
body of water each year from 1998 to 2003. Which human activity most
likely affected this body of water between 2000 and 2003? *
The amount of rainfall will increase.
O Rivers may be contaminated by sewage.
Light pollution in the town may decrease
O People will develop more farms in the town.
PLZZ HELP PLZ

Answers: 2


Other questions on the subject: Chemistry
Chemistry, 22.06.2019 07:00, coolkid2041
Calculate the number of moles of ethane in 100 grams
Answers: 3
Chemistry, 22.06.2019 15:00, hockeykid7583
Which are forms of frozen water? check all that apply. dew frost hail rain sleet
Answers: 2
Chemistry, 22.06.2019 20:00, teacherpreacher
For the reaction c6h14(g) & longrightarrow; c6h6(g) + 4h2(g), δp(h2)/δt was found to be 2.5 x 10⁻² atm/s, where δp(h2) is the change in pressure of hydrogen. determine δp(c6h14)/δt for this reaction at the same time.
Answers: 2
You know the right answer?
The line graph below shows the average amount of dissolved nutrients in a
body of water each year f...
Questions in other subjects:


Mathematics, 07.05.2020 07:04
Mathematics, 07.05.2020 07:04


Mathematics, 07.05.2020 07:04
Mathematics, 07.05.2020 07:04


