Chemistry, 02.02.2021 21:00 dontworry48
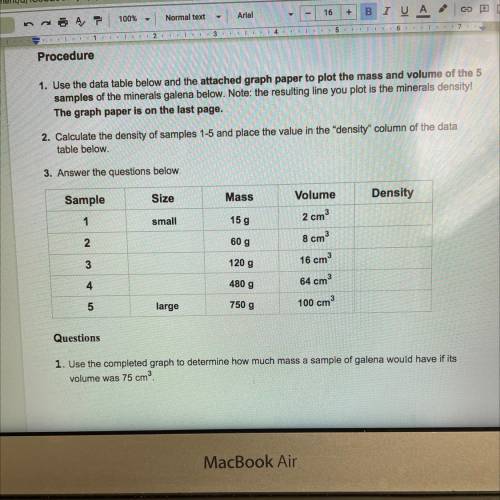
1. Use the data table below and the attached graph paper to plot the mass and volume of the 5
samples of the minerals galena below. Note: the resulting line you plot is the minerals density!
The graph paper is on the last page.
2. Calculate the density of samples 1-5 and place the value in the "density" column of the data
table below.
3. Answer the questions below
Sample
Size
Mass
Volume
Density
1
small
15 g
2 cm3
8 cm3
60 g
AN
120 g
16 cm3
480 g
64 cm3
5
large
750 g
100 cm
Questions


Answers: 1


Other questions on the subject: Chemistry

Chemistry, 21.06.2019 23:00, LarryJoeseph
Why are the trends and exceptions to the trends in ionization energy observed?
Answers: 1

Chemistry, 22.06.2019 08:40, kellymcdow5135
For each of the following compounds, write the formula then predict whether it would be a strong, weak, or non-electrolyte when placed in di water. for the ionic compounds only, put (s) or (aq) after the forrmula formula strong, weak or non electrolyte? a calcium hydroxide b. silver carbonate c. lead(ii) sulfate d. phosphorus trifluoride e. sodium phosphide f barium sulfate g. strontium acetate h. zinc nitrate
Answers: 3

Chemistry, 22.06.2019 14:00, hammackkatelyn60
The content of manganese (mn) in steel was determined spectrophotometrically and with the use of the standard addition method. an unknown sample of mn from a digested steel sample gave an absorbance of 0.185 when analyzed spectrophotometrically. when 5.00 ml of solution containing 95.5 ppm mn was added to 50.0 ml of the unknown steel solution (digested sample), the absorbance was 0.248. calculate the concentration, in parts-per-million (ppm), of mn in the digested steel sample solution.
Answers: 3

Chemistry, 22.06.2019 17:30, kevin72937
Consider the story you just read. all but one of the choices below indicate that something is living.
Answers: 1
You know the right answer?
1. Use the data table below and the attached graph paper to plot the mass and volume of the 5
sampl...
Questions in other subjects:


English, 31.10.2020 01:00

History, 31.10.2020 01:00

History, 31.10.2020 01:00


Arts, 31.10.2020 01:00

Mathematics, 31.10.2020 01:00


Mathematics, 31.10.2020 01:00


