
Chemistry, 17.12.2020 01:20 hntnhtthnyt
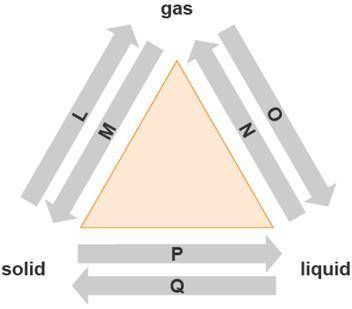
The diagram shows changes of state between solid, liquid, and gas. The atoms of a substance lose energy during a change of state. After the change, the atoms are close together but are able to slide past one another.
A diagram has a triangle at center with gas on top, liquid on bottom right, solid on bottom left. An arrow from gas to liquid is labeled O, and an arrow from liquid to gas is labeled N. An arrow from solid to liquid is labeled P, and an arrow from liquid to solid is labeled Q. An arrow from solid to gas is labeled L, and an arrow from gas to solid is labeled M.
Which arrow represents the change of state described above?
L
N
O
P

Answers: 2


Other questions on the subject: Chemistry
Chemistry, 22.06.2019 08:30, myamiller558
Which of the following would be an accurate picture of the earth during the summer time of the northern hemisphere?
Answers: 1
You know the right answer?
The diagram shows changes of state between solid, liquid, and gas. The atoms of a substance lose ene...
Questions in other subjects:


Mathematics, 09.03.2021 18:10
Mathematics, 09.03.2021 18:10

Biology, 09.03.2021 18:10


