
Chemistry, 14.12.2020 20:40 Hockeypro1127
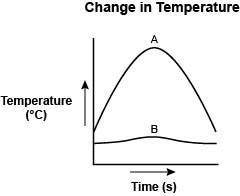
In an experiment, equal amounts of water and soil were first heated and then left to cool. The graph shows the change in temperature for each with time.
A graph with the title Change in Temperature is shown. The y axis title is Temperature in degree C and the x axis title is Time in seconds. An inverted U shaped curve labeled A is plotted. A flatter curved line labeled B is also shown plotted on the graph.
Which statement about the curves A and B is true?
Curve A represents how soil takes longer to heat and longer to cool.
Curve B represents how water takes longer to heat and longer to cool.
Curve A represents water as it heats rapidly and cools slowly.
Curve B represents soil as it heats slowly and cools rapidly.
If you don't understand, here's the image.

Answers: 1


Other questions on the subject: Chemistry
Chemistry, 21.06.2019 18:00, darg3990rgp2t0r2
Does anyone know a lot about how to: - calculate mass of magnesium metal - calculate the actual yield of magnesium oxide - calculate the theoretical yield of mgo - calculate the percent yield of mgo - determine the percent yield of mgo - determine the average percent yield of mgo i had to do an online lab and its asking these questions but i have no idea where to start or how to be able to find these things. i can post the chart of the data from the lab or if you can tell me exactly how i can find each.
Answers: 3
Chemistry, 22.06.2019 10:30, angemango3423
What is the empirical formula of c6h18o3? ch3o c2h5o c2h6o c2h5o5
Answers: 1
You know the right answer?
In an experiment, equal amounts of water and soil were first heated and then left to cool. The graph...
Questions in other subjects:

Physics, 23.10.2020 06:01

Mathematics, 23.10.2020 06:01
Mathematics, 23.10.2020 06:01
Mathematics, 23.10.2020 06:01
Mathematics, 23.10.2020 06:01

Business, 23.10.2020 06:01

English, 23.10.2020 06:01
Mathematics, 23.10.2020 06:01


