
Chemistry, 19.11.2020 05:40 SmartKitty
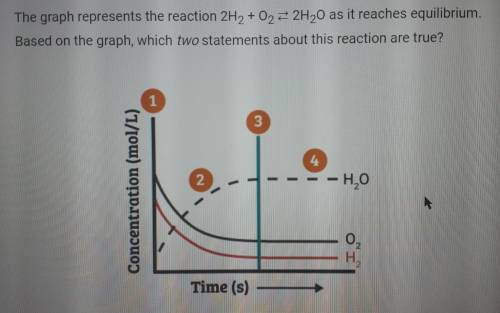
The graph represents the reaction 2H2 +02 = 2H20 as it reaches equilibrium. Based on the graph, which two statements about this reaction are true?
A. At point 2, the concentrations of H20, 02, and H2 are all changing toward their equilibrium concentrations.
B. The rate of formation of products is equal to the rate of formation of reactants only after point 4.
C. After point 2, the rate of formation of products is equal to the rate of formation of reactants.
D. At point 1, more reactants are converted to products than products are converted to reactants.

Answers: 2


Other questions on the subject: Chemistry
Chemistry, 21.06.2019 22:00, pettygirl13
Describe the particles of all three phases of matter in the root beer float. (how are the particles arranged and moving? )
Answers: 3
Chemistry, 22.06.2019 09:00, wkalpakchi
Given the following reaction: c3h8+5o2=3co2+4h20 how many grams of co2 will be produced 7 g of c3h8 and 98 g of o2
Answers: 1
You know the right answer?
The graph represents the reaction 2H2 +02 = 2H20 as it reaches equilibrium. Based on the graph, whic...
Questions in other subjects:


