
Chemistry, 17.11.2020 09:20 jazwhi1507
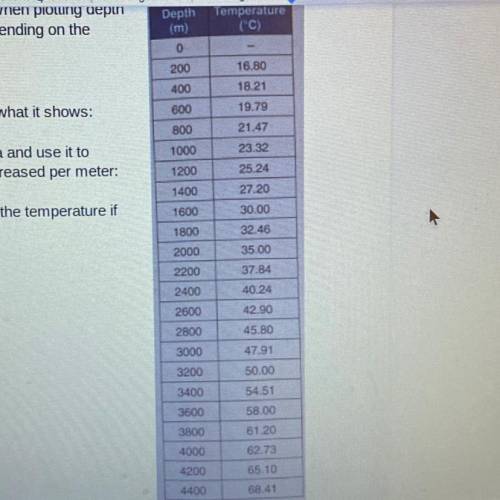
1. The data right shows the temperature data for the Kola Superdeep Borehole. Plot the data. When plotting depth data, the depth should be plotted descending on the y-axis.
2. Describe the shape of the graph and what it shows:
3. Draw a line of best fit through the data and use it to determine the rate of temperature increased per meter:
4. What would you expect to happen to the temperature if depth was increased?

Answers: 2


Other questions on the subject: Chemistry
Chemistry, 22.06.2019 13:00, naomicervero
Asubstance is a good conductor of electricity which of the following best explains a probable position of the substance in a periodic table
Answers: 3
You know the right answer?
1. The data right shows the temperature data for the Kola Superdeep Borehole. Plot the data. When pl...
Questions in other subjects:


Mathematics, 24.10.2019 20:43

Geography, 24.10.2019 20:43

History, 24.10.2019 20:43


