
Chemistry, 07.11.2020 14:00 SauceyNaee
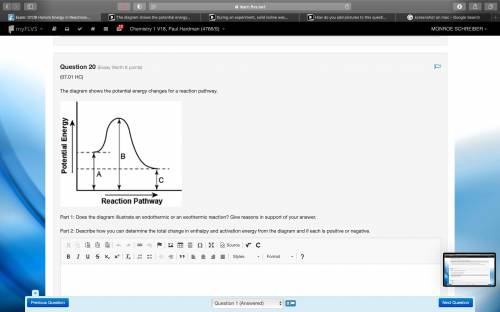
The diagram shows the potential energy changes for a reaction pathway. A curved lined graph is shown. The y axis of the graph has the title Potential Energy. The x axis of the graph has the title Reaction Pathway. The graph curve begins at a higher level and ends at a slightly lower level. A vertical line labeled A, starting from the x axis till the beginning of the graph line is shown. A vertical line labeled B, starting from the x axis till the uppermost hump in the graph curve is shown. Another vertical line labeled C is shown from starting from the x axis till the point where the graph curve ends. Part 1: Does the diagram illustrate an endothermic or an exothermic reaction? Give reasons in support of your answer. Part 2: Describe how you can determine the total change in enthalpy and activation energy from the diagram and if each is positive or negative.

Answers: 3


Other questions on the subject: Chemistry
Chemistry, 21.06.2019 17:00, kaylaamberd
Write the complete balanced equation for the reaction between lead (iv) oxide (pbo2) and water (h2o).
Answers: 1
Chemistry, 21.06.2019 22:20, andybiersack154
Asolution is made by dissolving 25.5 grams of glucose (c6h12o6) in 398 grams of water. what is the freezing point depression of the solvent if the freezing point constant is -1.86 °c/m? show all of the work needed to solve this problem.
Answers: 1
Chemistry, 22.06.2019 23:00, Mw3spartan17
What extra step distinguishes fermentation from glycolysis
Answers: 1
Chemistry, 23.06.2019 03:30, HalpMahOnMahH0meW0rk
Calculate the ph of a .10m nh4cl solution. the kb value for nh3 is 1.8×10^-5
Answers: 1
You know the right answer?
The diagram shows the potential energy changes for a reaction pathway. A curved lined graph is shown...
Questions in other subjects:


