
Chemistry, 21.10.2020 19:01 isaiahhuettnerowgg8d
Conservation of Mass Activity Worksheet
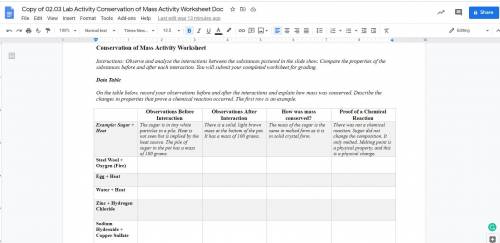
Instructions: Observe and analyze the interactions between the substances pictured in the slide show. Compare the properties of the substances before and after each interaction. You will submit your completed worksheet for grading.
Data Table
On the table below, record your observations before and after the interactions and explain how mass was conserved. Describe the changes in properties that prove a chemical reaction occurred. The first row is an example.
Observations Before Interaction
Observations After Interaction
How was mass conserved?
Proof of a Chemical Reaction
Example: Sugar + Heat:
Observations Before Interaction
The sugar is in tiny white particles in a pile. Heat is not seen but is implied by the heat source. The pile of sugar in the pot has a mass of 100 grams.
Observations After Interaction
There is a solid, light brown mass at the bottom of the pot. It has a mass of 100 grams.
How was mass conserved?
The mass of the sugar is the same in melted form as it is in solid crystal form.
Proof of a Chemical Reaction
There was not a chemical reaction. Sugar did not change the composition. It only melted. Melting point is a physical property, and this is a physical change.
Do This For
Steel Wool + Oxygen (Fire)
Egg + Heat
Water + Heat
Zinc + Hydrogen Chloride
Sodium Hydroxide + Copper Sulfate

Answers: 2


Other questions on the subject: Chemistry
Chemistry, 22.06.2019 14:00, emilyproce
In the space, show a correct numerical setup for calculating the number of moles of co2 present in 11 grams of co2
Answers: 1
Chemistry, 22.06.2019 19:00, HaydenSturgis1
Which is the solubility product expression for caf2(s)?  [ca2+]/[f–]2  [ca2+][f2–]  [ca]+[f]2  [ca2+][f–]2
Answers: 3
Chemistry, 22.06.2019 21:30, rondonalba
Electromagnets coils of wire paper clips picked up 10 3 15 6 20 9 25 12 ms. owens' class was studying magnets. ms. owens showed her students how to make an electromagnet using a nail, a d-cell battery, and plastic coated wire. the students wrapped the wire around the nail and then attached the ends to the battery. when they were finished, they tested their magnets by investigating how many paperclips their magnets could pick up. they also tested whether they could increase the strength of their electromagnets by using more coils of wire. they recorded the class average of their results in the data table seen here. ms. owens asked her students to graph their data in a line graph. how should the students label the x-axis on their line graph? a) size of battery b) number of paper clips c) number of coils of wire d) strength of electromagnet
Answers: 2
You know the right answer?
Conservation of Mass Activity Worksheet
Instructions: Observe and analyze the interactions between...
Questions in other subjects:


Biology, 10.06.2021 16:40

Geography, 10.06.2021 16:40


English, 10.06.2021 16:40
Biology, 10.06.2021 16:40


