Page 1
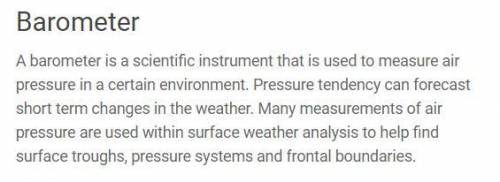
Question 4 (1 point)
What do the lines or isobars on this map show?
1
3
2.
✓
4
5
996 mb
1,000 mb
1,004 mh
equal temperatures
equal dew points
equal wind speeds
equal barometric pressures
please i need help you get 99 points if you help
This flow chart shows the amount of energy that is emitted by each type of light. ultraviolet > blue light > yellow light > red light (maximum energy) (minimum energy) in an experiment, shining which type of light on a strip of metal would be least likely to produce the photoelectric effect? ultraviolet light dim blue light bright red light bright yellow light
![\left[\begin{array}{ccc}Thanks,\\JustSomeIdiot\end{array}\right]](/tpl/images/0788/7431/f737c.png)