
Chemistry, 25.08.2020 18:01 smagallanes
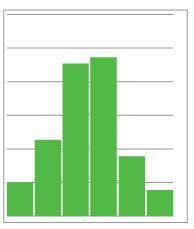
A scientist conducted research and plotted his results in the histogram shown below. Which of the following is the best measure of the center of the data?
Median
Mode
Mean
They are all appropriate

Answers: 2


Other questions on the subject: Chemistry
Chemistry, 21.06.2019 21:30, awdadaddda
How air particles exert a pressure on the inside of the balloon
Answers: 1
Chemistry, 22.06.2019 10:00, aschool2000
Water's surface tension and heat storage capacity are accounted for by its a) orbitals b) weight c) hydrogen bonds d) mass e) size
Answers: 2
You know the right answer?
A scientist conducted research and plotted his results in the histogram shown below. Which of the fo...
Questions in other subjects:


Mathematics, 21.11.2019 22:31
History, 21.11.2019 22:31


