
Chemistry, 24.06.2020 21:01 carlohillyard4633
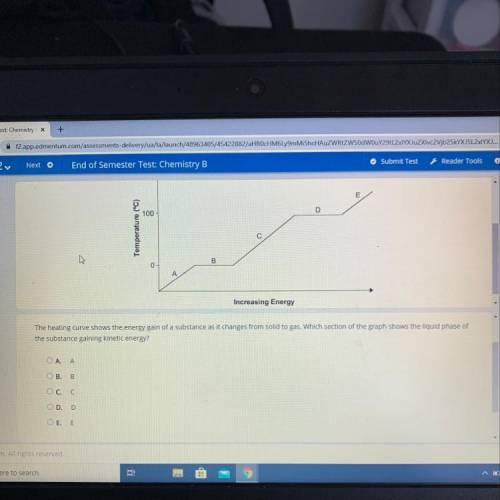
The heating curve shows the energy gain of a substance as it changes from solid to gas. Which section of the graph shows the liquid phase of the substance gaining kinetic energy?
A. A
B. B
C. C
D. D
E. E

Answers: 3


Other questions on the subject: Chemistry
Chemistry, 22.06.2019 06:30, irvinbhangal2
What effect might melting sea ice have for people who live in coastal areas?
Answers: 1
Chemistry, 22.06.2019 14:50, jonmorton159
Consider the following multistep reaction: a b→ab(slow) a ab→a2b(fast)−−−−−−−−−−−−−−−−− 2a b→a2b(overall) based on this mechanism, determine the rate law for the overall reaction. express your answer in standard masteringchemistry format. for example, if the rate law is k[a]3[b]2 type k*[a]^3*[b]^2
Answers: 3
You know the right answer?
The heating curve shows the energy gain of a substance as it changes from solid to gas. Which sectio...
Questions in other subjects:


Mathematics, 29.07.2019 04:40
Chemistry, 29.07.2019 04:40


