
Chemistry, 07.06.2020 01:57 jamesgraham577
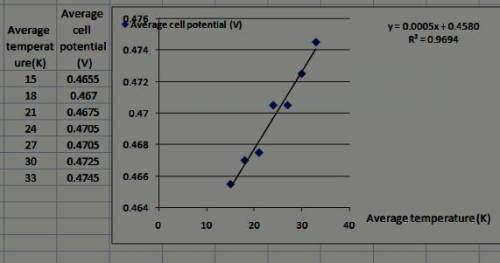
Convert the average temperatures for each collected data point given below from °C to K. Plot the average cell potentials E (y-axis) vs T (x-axis). The plot should be approximately linear. Add a trendline to find the best linear fit and write down the y-intercept and slope (b and m from the linear equation) for the trendline below.
Average Temperature in °C - Average Cell Potential (V)
15 - 0.465
18 - 0.467
21 - 0.468
24 - 4.69
27 - 0.471
30 - 0.472
33 - 0.474

Answers: 2


Other questions on the subject: Chemistry
Chemistry, 22.06.2019 02:30, caeyanij
When svante arrhenius first proposed his acid-base theory, he was a doctoral candidate. his professors thought his ideas were unfounded. within a decade, the arrhenius theory of acid-base was widely accepted and praised within the scientific world. arrhenius defined acids as compounds having ionizable hydrogen and bases as compounds with ionizable a) barium. b) hydronium. c) hydroxide. d) oxygen.
Answers: 3
You know the right answer?
Convert the average temperatures for each collected data point given below from °C to K. Plot the av...
Questions in other subjects:


Social Studies, 13.12.2019 01:31

History, 13.12.2019 01:31


