The graph indicates what about the relationship between atmospheric carbon dioxide and time
A...

Chemistry, 19.03.2020 03:02 muhammadcorley123456
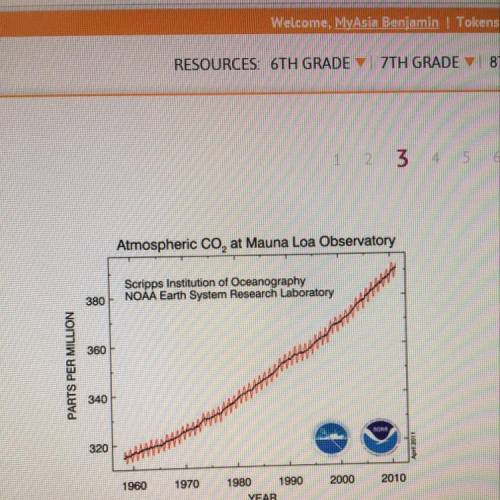
The graph indicates what about the relationship between atmospheric carbon dioxide and time
A over time, the amount of atmospheric carbon dioxide increases
B over time, the amount of atmospheric carbon dioxide decreases
C over time, the amount of atmospheric carbon dioxide stays the same
D over time, the amount of atmospheric carbon dioxide does not change
Submit

Answers: 2


Other questions on the subject: Chemistry
Chemistry, 21.06.2019 19:00, anonymous176
Iknow the answer to 13 is b and 14 is d. i just need to know why the correct answers are correct
Answers: 3
Chemistry, 22.06.2019 04:40, deedee363
*will mark you brainliest + 15 points ** why does the equilibrium of a system shift when the pressure is increased? a. to maximize the stress on the system b. to stop restoring equilibrium to the system c. to increase the total moles of gas in the system d. to decrease the total moles of gas in the system
Answers: 3
Chemistry, 22.06.2019 05:00, adrian128383
What forms when chemical reactions combine pollution with sunlight?
Answers: 1
Chemistry, 22.06.2019 06:00, palomaresmitchelle
There are 6.022, 104 atoms of hg in 1 mole of hg the number of atoms in 45 moles of hg can be found by multiplying 4.5 by 6.022, 102 which is the number of atoms in 4.5 moles of hg, correctly written in scientific notation with the correct number of significant figures? 0 21,109 0 21,100 271, 1024 27.099, 100 mark this and retum save and exit submit
Answers: 1
You know the right answer?
Questions in other subjects:

History, 24.06.2019 00:00

History, 24.06.2019 00:00


Mathematics, 24.06.2019 00:00


