
Chemistry, 11.02.2020 06:37 miargaree1823
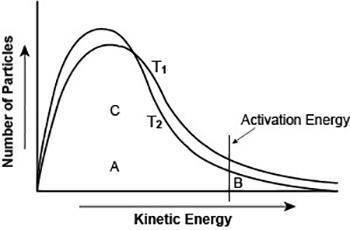
The graph shows the distribution of energy in the particles of two gas samples at different temperatures, T1 and T2. A, B, and C represent individual particles.
A graph is shown with two inverted graph curves running close to each other. One of the curves labeled T1 is slightly more spread out than the other labeled T2. The x axis of the graph has the title Kinetic Energy. The y axis of the graph has the title Number of Particles. A vertical line perpendicular to the x axis is shown. This vertical line is labeled Activation Energy. A point labeled B is shown on the right hand side of the vertical line. A point labeled A is shown in the lower left side of the vertical line. A particle labeled C is shown in the upper left side of the vertical line.
Based on the graph, which of the following statements is likely to be true?
Particle A and C are more likely to participate in the reaction than particle B.
Most of the particles of the two gases have very high speeds.
A fewer number of particles of gas at T1 are likely to participate in the reaction than the gas at T2.
The average speed of gas particles at T2 is lower than the average speed of gas particles at T1.

Answers: 3


Other questions on the subject: Chemistry
Chemistry, 22.06.2019 04:00, eborkins
Seltzer water is created by placing water under pressure with carbon dioxide gas. which of the following statements best describe seltzer water: a. the solution will be slightly acidic b. the solution will be slightly basic. the solution will be strongly acidic. d. the solution will be strongly basic. e. the solution will be neutral
Answers: 3
You know the right answer?
The graph shows the distribution of energy in the particles of two gas samples at different temperat...
Questions in other subjects:


Mathematics, 13.12.2019 05:31

History, 13.12.2019 05:31
History, 13.12.2019 05:31
Mathematics, 13.12.2019 05:31
Mathematics, 13.12.2019 05:31


Geography, 13.12.2019 05:31
Mathematics, 13.12.2019 05:31


