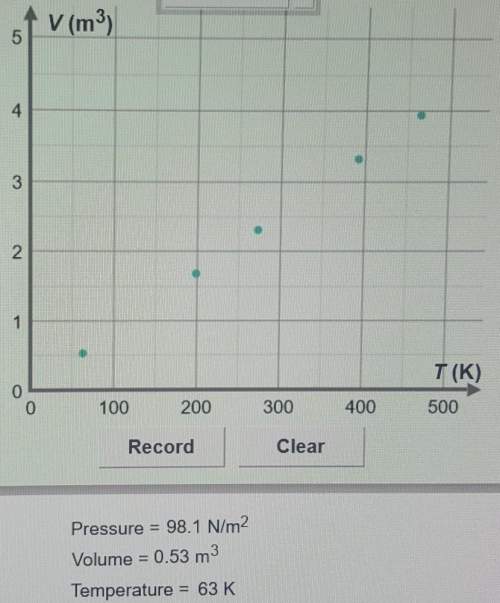
1. which measurement (with the units) is plotted on the x-axis?
2. which measurement (with the...

Chemistry, 30.08.2019 23:30 imtimthetatman
1. which measurement (with the units) is plotted on the x-axis?
2. which measurement (with the units) is plotted on the y-axis?
3. the temperature is 550 degrees, what would the volume be for it?
4. which one best describes the relationship shown in the graph?
a. there is a direct relationship between temperatures and volume. as one increases, so does the other
b. there is an inverse relationship between temperatures and volume. as one increases, the other decreases
c. there does not seem to be any relationship between temperature and volume
(the graph is up above and the data of the information is written underneath this message, i'm having a lot of trouble figuring out the answers for these question and would really appreciate someone explained how to solve these questions for me . you so much guys and have an amazing day! )
temperature pressure volume moles
1. 273 98.10 2.31 0.10
2. 465 98.10 3.94 0.10
3. 392 98.10 3.32 0.10
4. 199 98.10 1.69 0.10
5. 63 98.10 0.53 0.10

Answers: 2


Other questions on the subject: Chemistry
Chemistry, 23.06.2019 05:30, zeesharpe05
If c + di is a point on the circle, then | c + di |=
Answers: 2
Chemistry, 23.06.2019 07:30, 22emilyl530
Chris is about to do an experiment to measure the density of water at several temperatures. his teacher has him prepare and sign a safety contract before beginning the experiment. which term is mostlikely part of the safety contract
Answers: 3
Chemistry, 23.06.2019 14:20, bjbass899
Compounds a and b react to form compounds c and d according to the equation: aa + bb → cc + dd. under which conditions will the rate law be given by the equation: rate = k[a]a[b]b? a. the reaction takes place in one step. b. the reaction is endothermic. c. the reaction is exothermic. d. the reaction involves more than one step.
Answers: 3
You know the right answer?
Questions in other subjects:

Mathematics, 23.03.2021 05:10


Mathematics, 23.03.2021 05:10

Mathematics, 23.03.2021 05:10


