*if youre good at chemistry * * will mark you brainliest with 25 points *
the graph s...

Chemistry, 31.01.2020 10:48 markellg1128
*if youre good at chemistry * * will mark you brainliest with 25 points *
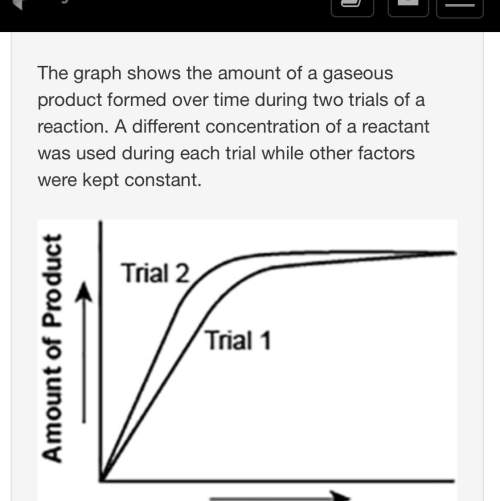
the graph shows the amount of a gaseous product formed over time during two trials of a reaction. a different concentration of a reactant was used during each trial while other factors were kept constant.
a graph is shown with two graph lines sloping upwards. the title on the x axis is time and the title on the y axis is amount of product. the graph line with a steeper slope is labeled trial 2 and the other is labeled trial 1.
which of the following statements explains which trial has a higher concentration of the reactant?
trial 1, because the final amount of product formed is higher.
trial 1, because this reaction lasted for a longer duration than trial 2.
trial 2, because this reaction was initially fast and slowed down later.
trial 2, because the amount of product formed per unit time is higher.

Answers: 2


Other questions on the subject: Chemistry
Chemistry, 22.06.2019 21:00, lucyamine0
As we move from left to right across the periodic table, what is the general trend? a) atomic radii increase. b) electronegavitiy decreases. c) nuclear shielding increases. d) metallic character decreases.
Answers: 1
Chemistry, 22.06.2019 22:00, jespinozagarcia805
In order to complete this lab. you will need to be familiar with some common chemistry terms. complete the chemical change puzzle and list the relevant terms and their meaning below a. rectant b. product c. supernate
Answers: 3
You know the right answer?
Questions in other subjects:

Biology, 03.02.2021 08:50


History, 03.02.2021 08:50
Biology, 03.02.2021 08:50

Biology, 03.02.2021 08:50
History, 03.02.2021 08:50


