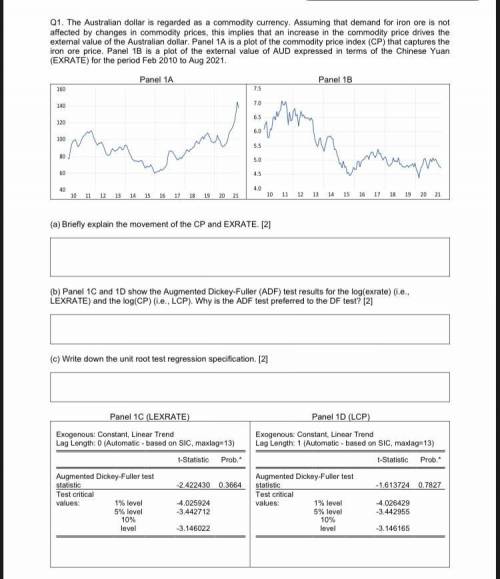
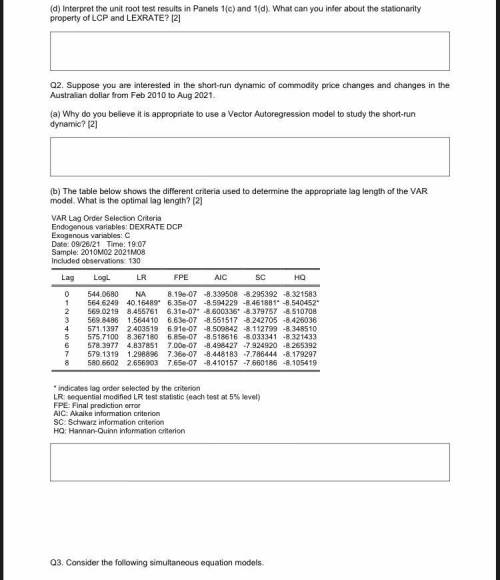
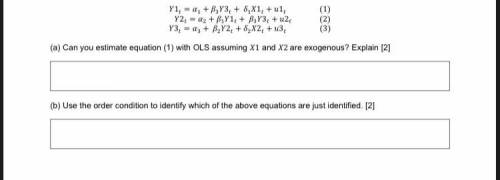
It is econometrics, please provide clear solutions
...

Business, 17.10.2021 09:30 cairolove228
It is econometrics, please provide clear solutions


Answers: 3


Other questions on the subject: Business

Business, 21.06.2019 22:50, nayelimoormann
The following data pertains to activity and costs for two months: june july activity level in 10,000 12,000 direct materials $16,000 $ ? fixed factory rent 12,000 ? manufacturing overhead 10,000 ? total cost $38,000 $42,900 assuming that these activity levels are within the relevant range, the manufacturing overhead for july was: a) $10,000 b) $11,700 c) $19,000 d) $9,300
Answers: 2

Business, 22.06.2019 02:00, camperangie3364
Jamie lee is reviewing her finances one month later. she has provided the actual amounts paid below. use the cash budget table below to her identify the variances in her budget. each answer must have a value for the assignment to be complete. enter "0" for any unused categories. actual amounts income: monthly expenses: gross monthly salary $2,315 rent obligation $260 net monthly salary $1,740 utilities/electricity $130 savings allocation: utilities/water $10 regular savings $130 utilities/cable tv $155 rainy-day savings $20 food $160 entertainment: gas/maintenance $205 cake decorating class $90 credit card payment $25 movies with friends $50 car insurance $75 clothing $145 budgeted amounts assets: monthly expenses: checking account $1,850 rent obligation $225 emergency fund savings account $4,300 utilities/electricity $75 car $5,200 utilities/water $35 computer & ipad $1,100 utilities/cable tv $120 liabilities: food $115 student loan $6,600 gas/maintenance $95 credit card balance $1,000 credit card payment $45 income: car insurance $45 gross monthly salary $2,155 clothing $45 net monthly salary $1,580 entertainment: savings allocation: cake decorating class $90 regular savings $130 movies with friends $50 rainy day savings $20
Answers: 2

Business, 22.06.2019 05:10, Kaitneedshelps
1. descriptive statistics quickly describe large amounts of data can predict future stock returns with surprising accuracy statisticians understand non-numeric information, like colors refer mainly to patterns that can be found in data 2. a 15% return on a stock means that 15% of the original purchase price of the stock returns to the seller at the end of the year 15% of the people who purchased the stock will see a return the stock is worth 15% more at the end of the year than at the beginning the stock has lost 15% of its value since it was originally sold 3. a stock purchased on january 1 cost $4.35 per share. the same stock, sold on december 31 of the same year, brought in $4.75 per share. what was the approximate return on this stock? 0.09% 109% 1.09% 9% 4. a stock sells for $6.99 on december 31, providing the seller with a 6% annual return. what was the price of the stock at the beginning of the year? $6.59 $1.16 $7.42 $5.84
Answers: 3

Business, 22.06.2019 05:30, mem8163
U. s. internet advertising revenue grew at the rate of r(t) = 0.82t + 1.14 (0 ≤ t ≤ 4) billion dollars/year between 2002 (t = 0) and 2006 (t = 4). the advertising revenue in 2002 was $5.9 billion.† (a) find an expression f(t) giving the advertising revenue in year t.
Answers: 1
You know the right answer?
Questions in other subjects:

Social Studies, 10.07.2019 01:30


History, 10.07.2019 01:30

History, 10.07.2019 01:30

Social Studies, 10.07.2019 01:30

Mathematics, 10.07.2019 01:30

Social Studies, 10.07.2019 01:30


Social Studies, 10.07.2019 01:30


