subject
Business, 17.10.2019 12:30 flores1717

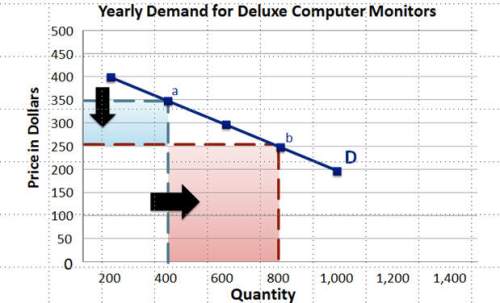
In the above diagram, the demand for computer monitors is price
a.
elastic
b.
fixed
c.
inelastic
d.
intolerant


In the above diagram, the demand for computer monitors is price a. elastic b.

ansver
Answers: 2

Other questions on the subject: Business

image
Business, 21.06.2019 21:20, jesus3426
According to the u. s. census bureau (), the median household income in the united states was $23,618 in 1985, $34,076 in 1995, $46,326 in 2005, and $57,230 in 2015. in purchasing power terms, how did family income compare in each of those four years? you will need to know that the cpi (multiplied by 100, 1982–1984 = 100) was 107.6 in 1985, 152.4 in 1995, 195.3 in 2005, and 237.0 in 2015
Answers: 3
image
Business, 22.06.2019 12:20, Tierriny576
If jobs have been undercosted due to underallocation of manufacturing overhead, then cost of goods sold (cogs) is too low and which of the following corrections must be made? a. decrease cogs for double the amount of the underallocation b. increase cogs for double the amount of the underallocation c. decrease cogs for the amount of the underallocation d. increase cogs for the amount of the underallocation
Answers: 3
image
Business, 22.06.2019 15:20, babyduck0664
Martinez company has the following two temporary differences between its income tax expense and income taxes payable. 2017 2018 2019 pretax financial income $873,000 $866,000 $947,000 (2017' 2018, 2019) excess depreciation expense on tax return (29,400 ) (39,000 ) (9,600 ) (2017' 2018, 2019) excess warranty expense in financial income 20,000 9,900 8,300 (2017' 2018, 2019) taxable income $863,600 $836,900 $945,700(2017' 2018, 2019) the income tax rate for all years is 40%. instructions: a. prepare the journal entry to record income tax expense, deferred income taxes, and income taxes payable for 2017, 2018, and 2019. b. assuming there were no temporary differences prior to 2016, indicate how deferred taxes will be reported on the 2016 balance sheet. button's warranty is for 12 months. c. prepare the income tax expense section of the income statement for 2017, beginning with the line, "pretax financial income."
Answers: 3
image
Business, 22.06.2019 20:30, ilovevegene
Blue computers, a major pc manufacturer in the united states, currently has plants in kentucky and pennsylvania. the kentucky plant has a capacity of 1 million units a year and the pennsylvania plant has a capacity of 1.5 million units a year. the firm divides the united states into five markets: northeast, southeast, midwest, south, and west. each pc sells for $1,000. the firm anticipates a 50 perc~nt growth in demand (in each region) this year (after which demand will stabilize) and wants to build a plant with a capacity of 1.5 million units per year to accommodate the growth. potential sites being considered are in north carolina and california. currently the firm pays federal, state, and local taxes on the income from each plant. federal taxes are 20 percent of income, and all state and local taxes are 7 percent of income in each state. north carolina has offered to reduce taxes for the next 10 years from 7 percent to 2 percent. blue computers would like to take the tax break into consideration when planning its network. consider income over the next 10 years in your analysis. assume that all costs remain unchanged over the 10 years. use a discount factor of 0.1 for your analysis. annual fixed costs, production and shipping costs per unit, and current regional demand (before the 50 percent growth) are shown in table 5-13. (a) if blue computers sets an objective of minimizing total fixed and variable costs, where should they build the new plant? how should the network be structured? (b) if blue computers sets an objective of maximizing after-tax profits, where should they build the new plant? how should the network be structured? variable production and shipping cost ($/unit) annual fixed cost northeast southeast midwest south west (million$) kentucky 185 180 175 175 200 150 pennsylvania 170 190 180 200 220 200 n. carolina 180 180 185 185 215 150 california 220 220 195 195 175 150 demand ('000 units/month) 700 400 400 300 600
Answers: 3
You know the right answer?
In the above diagram, the demand for computer monitors is price
a.
elastic
b.

Questions in other subjects:

Konu
Mathematics, 24.05.2021 19:30