
Business, 08.04.2021 01:00 bangtann77
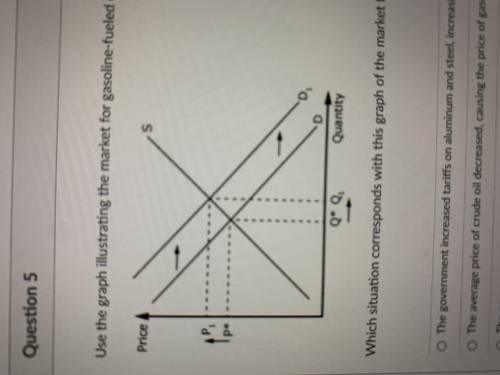
Use the graph illustrating the market for gasoline-fueled cars to answer the question.
Which situation corresponds with this graph of the market for gasoline-fueled cars?
The government increased tariffs on aluminum and steel , increasing the cost of producing all cars.
The average price of crude all decreased , causing the price of gasoline to decrease as well
The government strengthened safety standards , forcing producers to include more safety equipment in all cars
The average price of lithiurn decreased , causing the price of batteries used in electric cars to decrease .

Answers: 1


Other questions on the subject: Business
Business, 21.06.2019 21:30, cesar566
In its 2016 annual report, caterpillar inc. reported the following (in millions): 2016 2015 sales $38,537 $47,011 cost of goods sold 28,309 33,546 as a percentage of sales, did caterpillar's gross profit increase or decrease during 2016? select one: a. gross profit increased from 26.8% to 28.6% b. gross profit decreased from 28.6% to 26.5% c. gross profit increased from 71.4% to 73.2% d. gross profit decreased from 73.2% to 71.4% e. there is not enough information to answer the question.
Answers: 2
Business, 22.06.2019 09:40, leomessifanboy678
As related to a company completing the purchase to pay process, is there an accounting journal entry "behind the scenes" when xyz company pays for the goods within 10 days of the invoice (gross method is used for discounts and terms are 2/10 net 30) that updates the general ledger?
Answers: 3
Business, 22.06.2019 13:00, shayneseaton
Reliability and validity reliability and validity are two important considerations that must be made with any type of data collection. reliability refers to the ability to consistently produce a given result. in the context of psychological research, this would mean that any instruments or tools used to collect data do so in consistent, reproducible ways. unfortunately, being consistent in measurement does not necessarily mean that you have measured something correctly. to illustrate this concept, consider a kitchen scale that would be used to measure the weight of cereal that you eat in the morning. if the scale is not properly calibrated, it may consistently under- or overestimate the amount of cereal that’s being measured. while the scale is highly reliable in producing consistent results (e. g., the same amount of cereal poured onto the scale produces the same reading each time), those results are incorrect. this is where validity comes into play. validity refers to the extent to which a given instrument or tool accurately measures what it’s supposed to measure. while any valid measure is by necessity reliable, the reverse is not necessarily true. researchers strive to use instruments that are both highly reliable and valid.
Answers: 1
Business, 22.06.2019 22:00, isabellainksow87vn
Suppose that a paving company produces paved parking spaces (q) using a fixed quantity of land (t) and variable quantities of cement (c) and labor (l). the firm is currently paving 1,000 parking spaces. the firm's cost of cement is $3 comma 600.003,600.00 per acre covered (c) and its cost of labor is $35.0035.00/hour (w). for the quantities of c and l that the firm has chosen, mp subscript upper c baseline equals 60mpc=60 and mp subscript upper l baseline equals 7mpl=7. is this firm minimizing its cost of producing parking spaces?
Answers: 3
You know the right answer?
Use the graph illustrating the market for gasoline-fueled cars to answer the question.
Which situat...
Questions in other subjects:


Biology, 17.10.2019 08:10

Social Studies, 17.10.2019 08:10
Mathematics, 17.10.2019 08:10

Mathematics, 17.10.2019 08:10

English, 17.10.2019 08:10


