
Business, 26.02.2021 02:30 Legoman29305
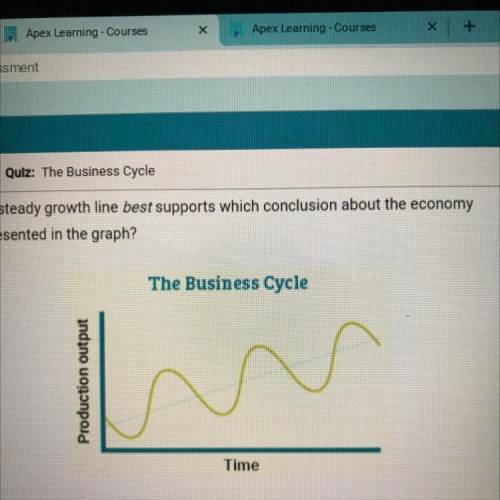
The steady growth line best supports which conclusion about the economy
represented in the graph?
The Business Cycle
Production output
h w
Time
A The economy never experiences significant periods of contraction
.
B. The economy does not display consistent patterns in its business
cycles
C. The economy improves steadily over several business cycleding
D. The economy has pronounced troughs but no clear peaks.

Answers: 3


Other questions on the subject: Business
Business, 22.06.2019 11:20, greatsavagebeast
Mae jong corp. issues $1,000,000 of 10% bonds payable which may be converted into 10,000 shares of $2 par value ordinary shares. the market rate of interest on similar bonds is 12%. interest is payable annually on december 31, and the bonds were issued for total proceeds of $1,000,000. in accounting for these bonds, mae jong corp. will: (a) first assign a value to the equity component, then determine the liability component. (b) assign no value to the equity component since the conversion privilege is not separable from the bond.(c) first assign a value to the liability component based on the face amount of the bond.(d) use the “with-and-without” method to value the compound instrument.
Answers: 3
Business, 22.06.2019 14:30, Hannahdavy5434
Stella company sells only two products, product a and product b. product a product b total selling price $50 $30 variable cost per unit $20 $10 total fixed costs $2,110,000 stella sells two units of product a for each unit it sells of product b. stella faces a tax rate of 40%. stella desires a net afterminustax income of $54,000. the breakeven point in units would be
Answers: 3
Business, 22.06.2019 22:40, michelerin9486
Utilization will always be lower than efficiency because: a. effective capacity is greater than design capacityb. expected output is less than actual output. c. effective capacity equals design capacity. d. effective capacity is less than design capacity. e. expected output is less than rated capacity.
Answers: 3
Business, 23.06.2019 00:30, genyjoannerubiera
Listed below are several transactions that took place during the first two years of operations for the law firm of pete, pete, and roy. year 1 year 2amounts billed to clients for services rendered $ 170,000 $ 220,000 cash collected from clients 160,000 190,000 cash disbursements salaries paid to employees for services rendered during the year 90,000 100,000 utilities 30,000 40,000 purchase of insurance policy 60,000 0 in addition, you learn that the company incurred utility costs of $35,000 in year 1, that there were no liabilities at the end of year 2, no anticipated bad debts on receivables, and that the insurance policy covers a three-year period. required: 1. & 3. calculate the net operating cash flow for years 1 and 2 and determine the amount of receivables from clients that the company would show in its year 1 and year 2 balance sheets prepared according to the accrual accounting model.2. prepare an income statement for each year according to the accrual accounting model.
Answers: 1
You know the right answer?
The steady growth line best supports which conclusion about the economy
represented in the graph?
Questions in other subjects:

Mathematics, 03.10.2019 05:50

Physics, 03.10.2019 05:50

History, 03.10.2019 05:50
Mathematics, 03.10.2019 05:50
History, 03.10.2019 05:50


