
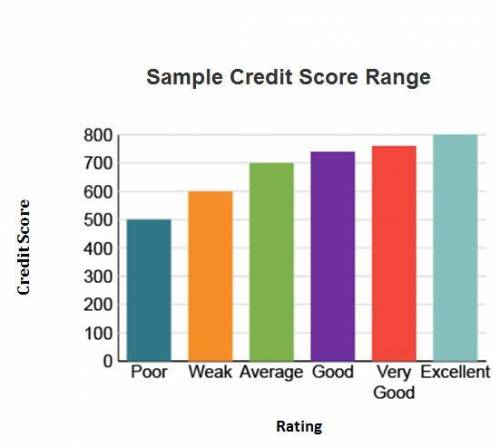
The chart shows a range of credit scores.
A bar chart titled Sample Credit Score Range has Rating on the x-axis, and credit score on the y-axis, from 0 to 800 in increments of 100. A poor credit score is 500, a weak score is 600, an average score is 700, a good score is 730, a very good score is 750, and an excellent score is 800.
A credit score between 500 and 600 means a consumer would most likely
find it easy to get a loan.
find it hard to get a loan.
get a loan with low payments.
get a loan with low interest.

Answers: 3


Other questions on the subject: Business
Business, 22.06.2019 11:00, cedricevans41p4j3kx
The following information is available for ellen's fashions, inc. for the current month. book balance end of month $ 7 comma 000 outstanding checks 700 deposits in transit 4 comma 500 service charges 120 interest revenue 45 what is the adjusted book balance on the bank reconciliation?
Answers: 2
Business, 22.06.2019 16:00, winstonbendariovvygn
If the family’s net monthly income is 7,800 what percent of the income is spent on food clothing and housing?
Answers: 3
Business, 22.06.2019 20:00, nestergurl101
With the slowdown of business, how can starbucks ensure that the importance of leadership development does not get overlooked?
Answers: 3
Business, 22.06.2019 20:20, laidbackkiddo412
Tl & co. is following a related-linked diversification strategy, and soar inc. is following a related-constrained diversification strategy. how do the two firms differ from each other? a. soar inc. generates 70 percent of its revenues from its primary business, while tl & co. generates only 10 percent of its revenues from its primary business. b. soar inc. pursues a backward diversification strategy, while tl & co. pursues a forward diversification strategy. c. tl & co. will share fewer common competencies and resources between its various businesses when compared to soar inc. d. tl & co. pursues a differentiation strategy, and soar inc. pursues a cost-leadership strategy, to gain a competitive advantage.
Answers: 3
You know the right answer?
The chart shows a range of credit scores.
A bar chart titled Sample Credit Score Range has Rating o...
Questions in other subjects:

History, 26.07.2019 18:00


Computers and Technology, 26.07.2019 18:00
Computers and Technology, 26.07.2019 18:00


