Business, 19.11.2020 22:10 jordonlewis
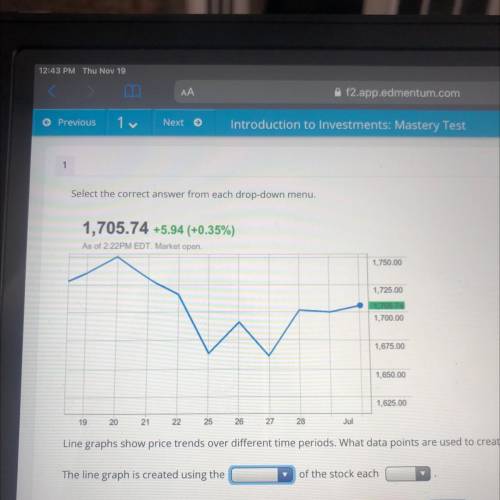
HELP ASAP Line graphs show price trends over different time periods. What data points are used to create a line graph on the stock quote shown? The line graph is created using the (close price, open price, volume) of the stock each (day, month).


Answers: 1


Other questions on the subject: Business

Business, 22.06.2019 11:40, Josias13
In early january, burger mania acquired 100% of the common stock of the crispy taco restaurant chain. the purchase price allocation included the following items: $4 million, patent; $3 million, trademark considered to have an indefinite useful life; and $5 million, goodwill. burger mania's policy is to amortize intangible assets with finite useful lives using the straight-line method, no residual value, and a five-year service life. what is the total amount of amortization expense that would appear in burger mania's income statement for the first year ended december 31 related to these items?
Answers: 2

Business, 22.06.2019 15:40, brashley
Acompany manufactures x units of product a and y units of product b, on two machines, i and ii. it has been determined that the company will realize a profit of $3 on each unit of product a and $4 on each unit of product b. to manufacture a unit of product a requires 7 min on machine i and 5 min on machine ii. to manufacture a unit of product b requires 8 min on mchine i and 5 min on machine ii. there are 175 min available on machine i and 125 min available on machine ii in each work shift. how many units of a product should be produced in each shift to maximize the company's profit p?
Answers: 2

Business, 22.06.2019 21:30, mjstew00763
An allergy products superstore buys 6000 of their most popular model of air filters each year. the price of the air filters is $18. the cost of ordering and receiving shipments is $12 per order. accounting estimates annual carrying costs are 20% of the price. the supplier lead time is 2 days. the store operates 240 days per year. each order is received from the supplier in a single delivery. there are no quantity discounts. what is the store’s minimum total annual cost of placing orders & carrying inventory?
Answers: 1

Business, 22.06.2019 22:50, brookephillips1099
Total marketing effort is a term used to describe the critical decision factors that affect demand: price, advertising, distribution, and product quality. define the variable x to represent total marketing effort. a typical model that is used to predict demand as a function of total marketing effort is based on the power function: d = axb suppose that a is a positive number. different model forms result from varying the constant b. sketch the graphs of this model for b = 0, b = 1, 0< b< 1, b< 0, and b> 1. (we encourage you to use excel to do this.) what does each model tell you about the relationship between demand and marketing effort? what assumptions are implied? are they reasonable? how would you go about selecting the appropriate model?
Answers: 1
You know the right answer?
HELP ASAP Line graphs show price trends over different time periods. What data points are used to cr...
Questions in other subjects:


Biology, 25.06.2021 07:30


Mathematics, 25.06.2021 07:30


Mathematics, 25.06.2021 07:30


