
Business, 18.11.2020 22:20 lizdeleon248
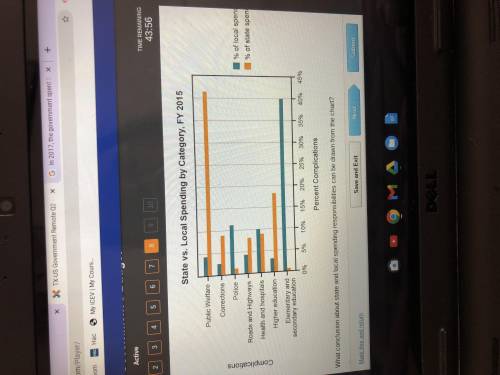
What conclusion about state and local spending responsibilities can be drawn from the chart?

Answers: 2


Other questions on the subject: Business
Business, 21.06.2019 16:00, maddigrace3
Five times the sum of a number and 27 is greater then or equal to six times the of that number and 26. what is the solution set to this proportion?
Answers: 1
Business, 22.06.2019 12:50, angelrenee2000
There is a small, family-owned store that sells food and household goods in a small town. the owners have good relations with the community, especially with local farmers who supply much of the food. the farmers aren't organized into a cooperative or union, and the store deals with each individually. suppose the store wanted to buy some farms to control the supply of certain vegetables. how would you classify this strategic move? select one: a. horizontal integration b. forward integration c. backward integration d. concentric integration
Answers: 2
Business, 22.06.2019 21:00, gd9075
Haley photocopying purchases a paper from an out-of-state vendor. average weekly demand for paper is 150 cartons per week for which haley pays $15 per carton. in bound shipments from the vendor average 1000 cartoons with an average lead time of 3 weeks. haley operates 52 weeks per year; it carries a 4-week supply of inventory as safety stock and no anticipation inventory. the vendor has recently announced that they will be building a faculty near haley photocopying that will reduce lead time to one week. further, they will be able to reduce shipments to 200 cartons. haley believes that they will be able to reduce safety stock to a 1-week supply. what impact will these changes make to haley’s average inventory level and its average aggregated inventory value?
Answers: 1
Business, 22.06.2019 22:20, PrisonKing3749
David consumes two things: gasoline (q 1) and bread (q 2). david's utility function is u(q 1, q 2)equals70q 1 superscript 0.5 baseline q 2 superscript 0.5. let the price of gasoline be p 1, the price of bread be p 2, and income be y. derive david's demand curve for gasoline. david's demand for gasoline is q 1equals nothing. (properly format your expression using the tools in the palette. hover over tools to see keyboard shortcuts. e. g., a subscript can be created with the _ character.)
Answers: 1
You know the right answer?
What conclusion about state and local spending responsibilities can be drawn from the chart?...
Questions in other subjects:


Health, 25.09.2019 03:00


English, 25.09.2019 03:00
History, 25.09.2019 03:00


