
Business, 12.10.2020 17:01 yuki430p7szcq
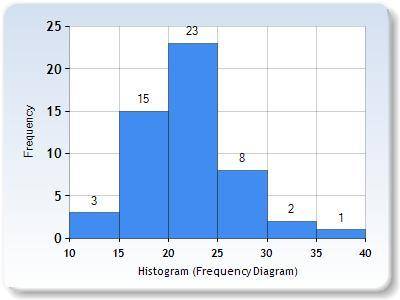
Suppose Procter & Gamble sells about 20 million bars of soap per week, but the demand is not constant and production management would like to get a better handle on how sales are distributed over the year. Let the following sales figures given in units of million bars represent the sales of bars per week over 1 year (in no particular order).
17.1 22.3 17 25.2 19.6 12.2 18.3 26.3 15.4 19.9 13.6 23.9 17.4 21.5 39.8 30.6 15 20.4 20.7 25.2 18.5 20.3 21.3 26.2 20.6 15.5 22.5 26.9 18.4 23.6 21.4 32.8 20 19.1 23.4 26.3 20.9 20.4 23.1 26.6 19.3 15.4 22.8 24.3 18.2 20.3 21.4 26.2 14.7 24.4 24 23.8
Required:
a. Construct a histogram chart to represent the data.
b. Creating a chart is not useful in and of itself unless it is properly interpreted. Write a brief analysis of the graph. What do you see in the graph that might be helpful to the production and sales people?

Answers: 1


Other questions on the subject: Business
Business, 22.06.2019 00:20, randallmatthew6124
Suppose an economy consists of three sectors: energy (e), manufacturing (m), and agriculture (a). sector e sells 70% of its output to m and 30% to a. sector m sells 30% of its output to e, 50% to a, and retains the rest. sector a sells 15% of its output to e, 30% to m, and retains the rest.
Answers: 1
Business, 22.06.2019 03:00, sayedaly2096
5. profit maximization and shutting down in the short run suppose that the market for polos is a competitive market. the following graph shows the daily cost curves of a firm operating in this market. 0 2 4 6 8 10 12 14 16 18 20 50 45 40 35 30 25 20 15 10 5 0 price (dollars per polo) quantity (thousands of polos) mc atc avc for each price in the following table, calculate the firm's optimal quantity of units to produce, and determine the profit or loss if it produces at that quantity, using the data from the previous graph to identify its total variable cost. assume that if the firm is indifferent between producing and shutting down, it will produce. (hint: you can select the purple points [diamond symbols] on the previous graph to see precise information on average variable cost.) price quantity total revenue fixed cost variable cost profit (dollars per polo) (polos) (dollars) (dollars) (dollars) (dollars) 12.50 135,000 27.50 135,000 45.00 135,000 if the firm shuts down, it must incur its fixed costs (fc) in the short run. in this case, the firm's fixed cost is $135,000 per day. in other words, if it shuts down, the firm would suffer losses of $135,000 per day until its fixed costs end (such as the expiration of a building lease). this firm's shutdown price—that is, the price below which it is optimal for the firm to shut down—is per polo.
Answers: 3
Business, 22.06.2019 17:40, briannagiddens
Adamson company manufactures four lines of garden tools. as a result of an activity analysis, the accounting department has identified eight activity cost pools. each of the product lines is produced in large batches, with the whole plant devoted to one product at a time. classify each of the following activities or costs as either unit-level, batch-level, product-level, or facility-level. activities (a) machining parts. (b) product design. (c) plant maintenance. (d) machine setup. (e) assembling parts. (f) purchasing raw materials. (g) property taxes. (h) painting.
Answers: 2
Business, 23.06.2019 00:10, Frenchfries13
Warren company plans to depreciate a new building using the double declining-balance depreciation method. the building cost $870,000. the estimated residual value of the building is $57,000 and it has an expected useful life of 20 years. assuming the first year's depreciation expense was recorded properly, what would be the amount of depreciation expense for the second year?
Answers: 2
You know the right answer?
Suppose Procter & Gamble sells about 20 million bars of soap per week, but the demand is not con...
Questions in other subjects:


Mathematics, 21.02.2021 14:00
Computers and Technology, 21.02.2021 14:00
Mathematics, 21.02.2021 14:00

Mathematics, 21.02.2021 14:00


