"A" represents the new quantity supplied, while "B"
represents the new quantity demanded
What...

Business, 28.06.2020 02:01 imtimthetatman
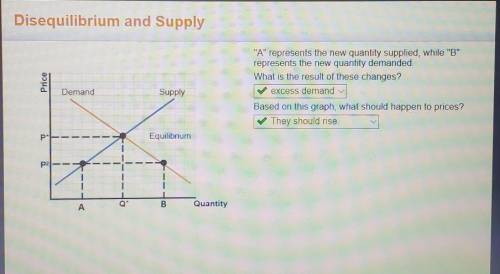
"A" represents the new quantity supplied, while "B"
represents the new quantity demanded
What is the result of these changes?
Based on this graph, what should happen to prices?
***ANSWERS ARE IN PICTURE!***

Answers: 3


Other questions on the subject: Business
Business, 21.06.2019 17:40, hallmansean04
Sodas in a can are supposed to contain an average of 12 ounces. this particular brand has a standard deviation of 0.1 ounces, with an average of 12.1 ounces. if the can's contents follow a normal distribution, what is the probability that the mean contents of a six pack are less than 12 ounces?
Answers: 2
Business, 21.06.2019 20:20, derpmuffin47
On february 3, smart company sold merchandise in the amount of $5,800 to truman company, with credit terms of 2/10, n/30. the cost of the items sold is $4,000. smart uses the perpetual inventory system and the gross method. truman pays the invoice on february 8, and takes the appropriate discount. the journal entry that smart makes on february 8 is:
Answers: 3
Business, 22.06.2019 18:00, Elephants12
What would not cause duff beer’s production possibilities curve to expand in the short run? a. improved manufacturing technology b. additional resources c. increased demand
Answers: 1
You know the right answer?
Questions in other subjects:

History, 16.12.2020 22:50

Mathematics, 16.12.2020 22:50
Mathematics, 16.12.2020 22:50


Mathematics, 16.12.2020 22:50
Mathematics, 16.12.2020 22:50


