

Answers: 2


Other questions on the subject: Business
Business, 21.06.2019 13:00, yilianblanco
Among the advantages of corporations are the ease of raising financial capital, professional management, and a. rapid promotions b. lower taxes c. limited liability d. specialization
Answers: 1
Business, 22.06.2019 02:30, llama1314
Sweeten company had no jobs in progress at the beginning of march and no beginning inventories. the company has two manufacturing departments--molding and fabrication. it started, completed, and sold only two jobs during march—job p and job q. the following additional information is available for the company as a whole and for jobs p and q (all data and questions relate to the month of march): molding fabrication total estimated total machine-hours used 2,500 1,500 4,000 estimated total fixed manufacturing overhead $ 10,000 $ 15,000 $ 25,000 estimated variable manufacturing overhead per machine-hour $ 1.40 $ 2.20 job p job q direct materials $ 13,000 $ 8,000 direct labor cost $ 21,000 $ 7,500 actual machine-hours used: molding 1,700 800 fabrication 600 900 total 2,300 1,700 sweeten company had no underapplied or overapplied manufacturing overhead costs during the month. required: for questions 1-8, assume that sweeten company uses a plantwide predetermined overhead rate with machine-hours as the allocation base. for questions 9-15, assume that the company uses departmental predetermined overhead rates with machine-hours as the allocation base in both departments. 1. what was the company’s plantwide predetermined overhead rate? (round your answer to 2 decimal places.) next
Answers: 2
Business, 22.06.2019 05:10, russboys3
The total value of your portfolio is $10,000: $3,000 of it is invested in stock a and the remainder invested in stock b. stock a has a beta of 0.8; stock b has a beta of 1.2. the risk premium on the market portfolio is 8%; the risk-free rate is 2%. additional information on stocks a and b is provided below. return in each state state probability of state stock a stock b excellent 15% 15% 5% normal 50% 9% 7% poor 35% -15% 10% what are each stock’s expected return and the standard deviation? what are the expected return and the standard deviation of your portfolio? what is the beta of your portfolio? using capm, what is the expected return on the portfolio? given your answer above, would you buy, sell, or hold the portfolio?
Answers: 1
Business, 22.06.2019 14:40, ZoomZoom44
You are purchasing a bond that currently sold for $985.63. it has the time-to-maturity of 10 years and a coupon rate of 6%, paid semi-annually. the bond can be called for $1,020 in 3 years. what is the yield to maturity of this bond?
Answers: 2
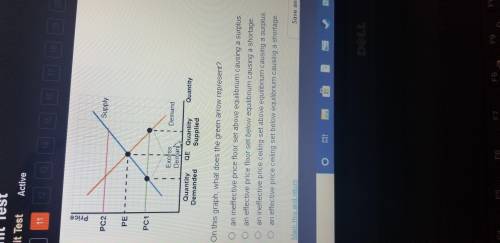
You know the right answer?
The graph shows the price of a good compared to the quantity demanded and the quantity supplied. On...
Questions in other subjects:


Mathematics, 04.02.2020 17:03
Mathematics, 04.02.2020 17:03
Mathematics, 04.02.2020 17:03

Social Studies, 04.02.2020 17:03

History, 04.02.2020 17:43

Physics, 04.02.2020 17:43


