
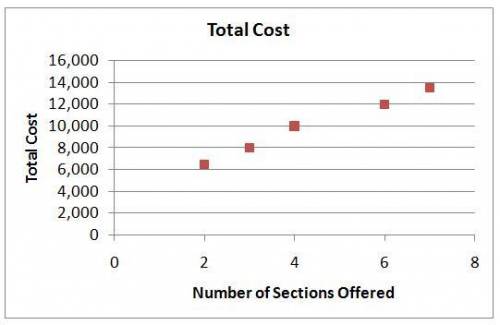
Professor John Morton has just been appointed chairperson of the Finance Department at Westland University. In reviewing the department’s cost records, Professor Morton has found the following total cost associated with Finance 101 over the last several terms:
Term Number of
Sections Offered Total
Cost
Fall, last year 7 $ 13,500
Winter, last year 3 $ 8,000
Summer, last year 6 $ 12,000
Fall, this year 2 $ 6,500
Winter, this year 4 $ 10,000
Professor Morton knows that there are some variable costs, such as amounts paid to graduate assistants, associated with the course. He would like to have the variable and fixed costs separated for planning purposes.
Required:
1. Prepare a scattergraph plot. (Place total cost on the vertical axis and number of sections offered on the horizontal axis.)
Instructions:
1. On the graph below, use the point tool (Fall last year) to plot number of sections offered on the horizontal axis and total cost on the vertical axis.
2. Repeat the same process for the plotter tools (winter last year to winter this year).
3. To enter exact coordinates, click on the point and enter the values of x and y.
4. To remove a point from the graph, click on the point and select delete option.
2(a). Using the least-squares regression method, estimate the variable cost per section and the total fixed cost per term for Finance 101. (Round your fixed cost and variable cost to nearest whole dollars.)
2(b). Express these estimates in the linear equation form Y = a + bX. (Round your fixed cost and variable cost to nearest whole dollars.)
3a. Assume that because of the small number of sections offered during the Winter Term this year, Professor Morton will have to offer ten sections of Finance 101 during the Fall Term. Compute the expected total cost for Finance 101. (Do not round your intermediate calculations. Round your final answer to nearest whole dollar.)

Answers: 2


Other questions on the subject: Business
Business, 21.06.2019 20:40, alix1234567888
Balances for each of the following accounts appear in an adjusted trial balance. identify each as an asset, liability, revenue, or expense. 1. accounts receivable 2. equipment 3. fees earned 4. insurance expense 5. prepaid advertising 6. prepaid rent 7. rent revenue 8. salary expense 9. salary payable 10. supplies 11. supplies expense 12. unearned rent
Answers: 3
Business, 21.06.2019 21:30, Officaljazz18
Dr. dow jones wants to know whether a problem-based approach to teaching economics will result in higher academic performance than his traditional method. of the six sections of economics 101 at his university, dr. jones randomly assigns three sections to the traditional method and three sections to the problem-based method for unit 1 of the course. then all sections switch the instructional method for unit 2. he plans to compare the performance of the two groups of sections on their unit 1 and unit 2 exams. this study employs a design.
Answers: 3
Business, 22.06.2019 08:50, cmflores3245
Suppose that in an economy the structural unemployment rate is 2.2 percent, the natural unemployment rate is 5.3 percent, and the cyclical unemployment rate is 2 percent. the frictional unemployment rate is percent and the actual unemployment rate (in this economy) is percent.
Answers: 2
Business, 22.06.2019 12:30, chycooper101
Rossdale co. stock currently sells for $68.91 per share and has a beta of 0.88. the market risk premium is 7.10 percent and the risk-free rate is 2.91 percent annually. the company just paid a dividend of $3.57 per share, which it has pledged to increase at an annual rate of 3.25 percent indefinitely. what is your best estimate of the company's cost of equity?
Answers: 1
You know the right answer?
Professor John Morton has just been appointed chairperson of the Finance Department at Westland Univ...
Questions in other subjects:

Mathematics, 07.01.2021 02:50
Mathematics, 07.01.2021 02:50
Mathematics, 07.01.2021 02:50

Geography, 07.01.2021 02:50


