
Business, 21.04.2020 22:17 raymondmunoz4451
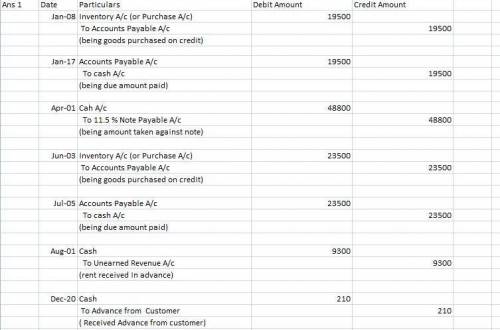
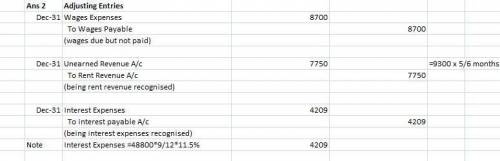
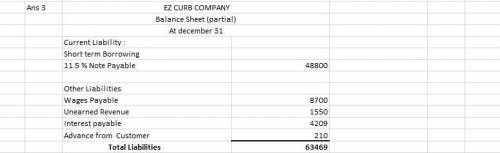
PB10-2 Recording and Reporting Current Liabilities with Evaluation of Effects on the Debt-to-Assets Ratio [LO 10-2, LO 10-5] Tiger Company completed the following transactions. The annual accounting period ends December 31. Jan. 3 Purchased merchandise on account at a cost of $24,000. (Assume a perpetual inventory system.) Jan. 27 Paid for the January 3 purchase. Apr. 1 Received $80,000 from Atlantic Bank after signing a 12-month, 5 percent promissory note. June 13 Purchased merchandise on account at a cost of $8,000. July 25 Paid for the June 13 purchase. July 31 Rented out a small office in a building owned by Tiger Company and collected eight months’ rent in advance amounting to $8,000. Dec. 31 Determined wages of $12,000 were earned but not yet paid on December 31 (Ignore payroll taxes). Dec. 31 Adjusted the accounts at year-end, relating to interest. Dec. 31 Adjusted the accounts at year-end, relating to rent. Required: 1. & 2. Prepare journal entries for each of the transactions through August 1 and any adjusting entries required on December 31. 3. Show how all of the liabilities arising from these items are reported on the balance sheet at December 31.

Answers: 3


Other questions on the subject: Business
Business, 21.06.2019 17:00, santos200154
The typical consumer's food basket in the base year 2015 is as follows: 30 chickens at $4 each 10 hams at $5 each 10 steaks at $8 each a chicken feed shortage causes the price of chickens to rise to $5.00 each in the year 2016. hams rise to $7.00 each, and the price of steaks is unchanged. a. calculate the change in the "cost-of-eating" index between 2015 and 2016. year cost of the basket 2015 $ 2016 $ instructions: enter your responses rounded to one decimal place. the official cost-of-eating index has by %. b. suppose that consumers are completely indifferent between two chickens and one ham. for this example, how large is the substitution bias in the official "cost-of-eating" index? the in the cost-of-eating index is %. the of inflation in the cost of eating reflects substitution bias.
Answers: 3
Business, 21.06.2019 21:20, ninilizovtskt
“wonderful! not only did our salespeople do a good job in meeting the sales budget this year, but our production people did a good job in controlling costs as well,” said kim clark, president of martell company. “our $11,150 overall manufacturing cost variance is only 3% of the $1,536,000 standard cost of products made during the year. that’s well within the 3% parameter set by management for acceptable variances. it looks like everyone will be in line for a bonus this year.” the company produces and sells a single product. the standard cost card for the product follows: standard cost card—per unit direct materials, 4.00 feet at $4.00 per foot $ 16.00 direct labor, 1.1 direct labor-hours at $13 per direct labor-hour 14.30 variable overhead, 1.1 direct labor-hours at $2.40 per direct labor-hour 2.64 fixed overhead, 1.1 direct labor-hours at $6.50 per direct labor-hour 7.15 standard cost per unit $ 40.09the following additional information is available for the year just completed: a. the company manufactured 20,000 units of product during the year. b. a total of 77,000 feet of material was purchased during the year at a cost of $4.25 per foot. all of this material was used to manufacture the 20,000 units. there were no beginning or ending inventories for the year. c. the company worked 24,000 direct labor-hours during the year at a direct labor cost of $12.50 per hour. d. overhead is applied to products on the basis of standard direct labor-hours. data relating to manufacturing overhead costs follow: denominator activity level (direct labor-hours) 19,000 budgeted fixed overhead costs $ 123,500 actual variable overhead costs incurred $ 64,800 actual fixed overhead costs incurred $ 120,900required: 1. compute the materials price and quantity variances for the year. (round standard price and actual price to 2 decimal places. indicate the effect of each variance by selecting "f" for favorable, "u" for unfavorable, and "none" for no effect (i. e., zero 2. compute the labor rate and efficiency variances for the year. (round standard rate and actual rate to 2 decimal places. indicate the effect of each variance by selecting "f" for favorable, "u" for unfavorable, and "none" for no effect (i. e., zero 3. for manufacturing overhead compute: a. the variable overhead rate and efficiency variances for the year. (round standard rate and actual rate to 2 decimal places. indicate the effect of each variance by selecting "f" for favorable, "u" for unfavorable, and "none" for no effect (i. e., zero b. the fixed overhead budget and volume variances for the year. (indicate the effect of each variance by selecting "f" for favorable, "u" for unfavorable, and "none" for no effect (i. e., zero
Answers: 2
Business, 22.06.2019 07:10, firdausmohammed80
mark, a civil engineer, entered into a contract with david. as per the contract, mark agreed to design and build a house for david for a specified fee. mark provided david with an estimation of the total cost and the contract was mutually agreed upon. however, during construction, when mark increased the price due to a miscalculation on his part, david refused to pay the amount. this scenario is an example of a mistake.
Answers: 1
Business, 22.06.2019 07:30, suyi14
An important application of regression analysis in accounting is in the estimation of cost. by collecting data on volume and cost and using the least squares method to develop an estimated regression equation relating volume and cost, an accountant can estimate the cost associated with a particular manufacturing volume. consider the following sample of production volumes and total cost data for a manufacturing operation. production volume (units) total cost ($) 400 4000 450 5000 550 5400 600 5900 700 6400 750 7000 compute b 1 and b 0 (to 2 decimals if necessary). b 1 b 0 complete the estimated regression equation (to 2 decimals if necessary). = + x what is the variable cost per unit produced (to 1 decimal)? $ compute the coefficient of determination (to 4 decimals). note: report r 2 between 0 and 1. r 2 = what percentage of the variation in total cost can be explained by the production volume (to 2 decimals)? % the company's production schedule shows 500 units must be produced next month. what is the estimated total cost for this operation (to 2 decimals)? $
Answers: 1
You know the right answer?
PB10-2 Recording and Reporting Current Liabilities with Evaluation of Effects on the Debt-to-Assets...
Questions in other subjects:


Mathematics, 17.11.2020 19:40

Physics, 17.11.2020 19:40
Mathematics, 17.11.2020 19:40
Medicine, 17.11.2020 19:40

Chemistry, 17.11.2020 19:40
Mathematics, 17.11.2020 19:40

French, 17.11.2020 19:40


