Business, 08.04.2020 23:30 ashleydenson1517
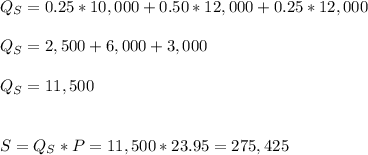
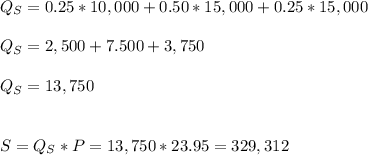
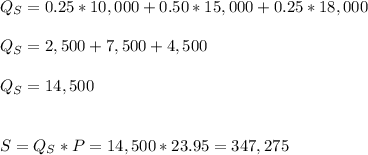
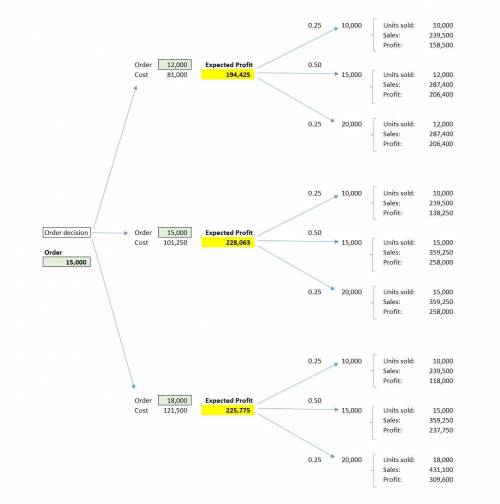
The national coffee store Farbucks needs to decide in August how many holiday insulated coffee mugs to order. Because the mugs are dated, those that are unsold by January 15 are considered a loss. These premium mugs sell for $23.95, and cost $6.75 each. Farbucks is uncertain of the demand. They believe that there is a 25% chance they will sell 10,000 mugs, a 50% chance they will sell 15,000, and a 25% chance they will sell 20,000. Build a decision tree to determine whether they should order 12,000, 15,000, or 18,000 mugs. Be sure that your model does not allow Farbucks to sell more mugs than it ordered: If demand is less than the order quantity, then the amount sold is the demand; otherwise, the amount sold is the order quantity.

Answers: 2


Other questions on the subject: Business


Business, 22.06.2019 15:20, sgalvis455
Abank has $132,000 in excess reserves and the required reserve ratio is 11 percent. this means the bank could have in checkable deposit liabilities and in (total) reserves.
Answers: 3

Business, 22.06.2019 21:40, summerhumphries3
Engberg company installs lawn sod in home yards. the company’s most recent monthly contribution format income statement follows: amount percent of sales sales $ 80,000 100% variable expenses 32,000 40% contribution margin 48,000 60% fixed expenses 38,000 net operating income $ 10,000 required: 1. compute the company’s degree of operating leverage. (round your answer to 1 decimal place.) 2. using the degree of operating leverage, estimate the impact on net operating income of a 5% increase in sales. (do not round intermediate calculations.) 3. construct a new contribution format income statement for the company assuming a 5% increase in sales.
Answers: 3

Business, 23.06.2019 00:10, jlang8
The food services division of cedar river amusement park inc. is studying the amount families who visit the amusement park spend per day on food and drink. a sample of 40 families who visited the park yesterday revealed they spent the following amounts: see worksheet 1 for data and answer the following questions: a. organize the data into a frequency distribution, using seven classes and 15 as the lower limit of the first class. what class interval did you select? b. what percent of families spent less than $45? c. what percent of families spent $55 or more? d. how many families spent from $65 to 74.99?
Answers: 3
You know the right answer?
The national coffee store Farbucks needs to decide in August how many holiday insulated coffee mugs...
Questions in other subjects:

Mathematics, 02.04.2021 02:30


Mathematics, 02.04.2021 02:30


History, 02.04.2021 02:30


