
Business, 24.01.2020 23:31 carterjavon6929
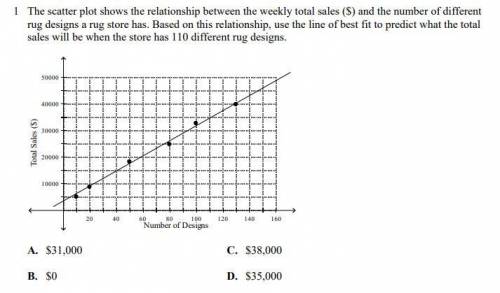
The scatter plot shows the relationship between the weekly total sales ($) and the number of different rug designs a rug store has. based on this relationship, use the line of best fit to predict what the total sales will be when the store has 110 different rug designs.
a. $31,000
b. $38,000
c. $0
d. $35,000

Answers: 2


Other questions on the subject: Business
Business, 22.06.2019 11:10, Emmaxox715
Yowell company granted a sales discount of $360 to a customer when it collected the amount due on account. yowell uses the perpetual inventory system. which of the following answers reflects the effects on the financial statements of only the discount? assets = liab. + equity rev. − exp. = net inc. cash flow a. (360 ) = na + (360 ) (360 ) − na = (360 ) (360 ) oa b. na = (360 ) + 360 360 − na = 360 na c. (360 ) = na + (360 ) (360 ) − na = (360 ) na d. na = (360 ) + 360 360 − na = 360 na
Answers: 1
Business, 22.06.2019 16:40, jojo171717
Based on what you learned about time management which of these statements are true
Answers: 1
Business, 22.06.2019 21:30, schneidersamant9242
Which is cheaper: eating out or dining in? the mean cost of a flank steak, broccoli, and rice bought at the grocery store is $13.04 (money. msn website, november 7, 2012). a sample of 100 neighborhood restaurants showed a mean price of $12.75 and a standard deviation of $2 for a comparable restaurant meal. a. develop appropriate hypotheses for a test to determine whether the sample data support the conclusion that the mean cost of a restaurant meal is less than fixing a comparable meal at home. b. using the sample from the 100 restaurants, what is the p-value? c. at a = .05, what is your conclusion? d. repeat the preceding hypothesis test using the critical value approach
Answers: 3
You know the right answer?
The scatter plot shows the relationship between the weekly total sales ($) and the number of differe...
Questions in other subjects:


Mathematics, 20.12.2019 15:31


Biology, 20.12.2019 15:31
English, 20.12.2019 15:31
Mathematics, 20.12.2019 15:31


