
Business, 26.11.2019 05:31 jholland03
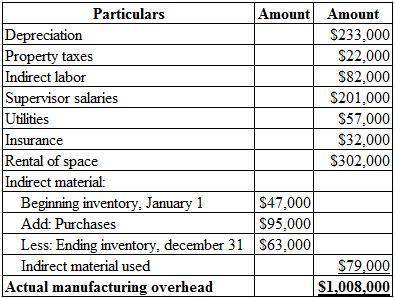
Calculate the overapplied or underapplied overhead for the year and prepare a journal entry to close out the manufacturing overhead account into cost of goods soldthe following information pertains to paramus metal works for the year just ended. budgeted direct-labor cost: 75,000 hours (practical capacity) at $16 per hour actual direct-labor cost: 80,000 hours at $17.50 per hour budgeted manufacturing overhead: $997,500budgeted selling and administrative expenses: $435,000actual manufacturing overhead: depreciation $ 233,000 property taxes 22,000 indirect labor 82,000 supervisory salaries 201,000 utilities 57,000 insurance 32,000 rental of space 302,000 indirect material (see data below) 79,000 indirect material: beginning inventory, january 1 47,000 purchases during the year 95,000 ending inventory, december 31 63,000 i calculated the cost driver is 13.30 , can someone me with the following-1. calculate the overapplied or underapplied overhead for the yea2.prepare a journal entry to close out the manufacturing overhead account into cost of goods sold

Answers: 1


Other questions on the subject: Business
Business, 21.06.2019 22:50, emmanuelcampbel
What happens when a bank is required to hold more money in reserve?
Answers: 3
Business, 22.06.2019 19:10, saabrrinnaaa
Do it! review 16-3 the assembly department for right pens has the following production data for the current month. beginning work in process units transferred out ending work in process 0 22,500 16,000 materials are entered at the beginning of the process. the ending work in process units are 70% complete as to conversion costs. compute the equivalent units of production for (a) materials and (b) conversion costs. materials conversion costs the equivalent units of production
Answers: 2
Business, 22.06.2019 19:30, darkremnant14
Problem page a medical equipment industry manufactures x-ray machines. the unit cost c (the cost in dollars to make each x-ray machine) depends on the number of machines made. if x machines are made, then the unit cost is given by the function =cx+−0.3x2126x31,935 . how many machines must be made to minimize the unit cost?
Answers: 3
You know the right answer?
Calculate the overapplied or underapplied overhead for the year and prepare a journal entry to close...
Questions in other subjects:


Mathematics, 11.03.2020 03:06
Mathematics, 11.03.2020 03:06


Biology, 11.03.2020 03:06


