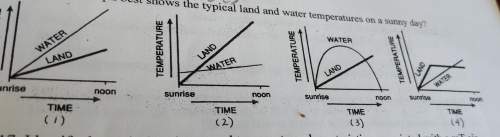
Which graph best shows the typical land and water temperatures in a sunny day
...

Biology, 01.08.2019 06:00 bridneyfondren
Which graph best shows the typical land and water temperatures in a sunny day

Answers: 1


Other questions on the subject: Biology
Biology, 22.06.2019 08:00, rosepotato789
Two students are working together on an experiment that measures the effect of different liquid fertilizers on the thickness of plants’ stems. which is most likely to result in the greatest amount of error in their scientific experiment? a. one student measures the plant stem widths by using calipers. the other student measures the widths of the same plant stems again by using a different pair of calipers. b. one student measures the plant stem widths by using calipers. the other student types the measurements as they are taken into a computer spreadsheet. c. one student weighs liquids for the experiment by using a calibrated scale. the other student weighs liquids for the experiment by using a different calibrated scale.
Answers: 1
Biology, 22.06.2019 12:40, charlesgtro7066
In which part of the body is a ball-and-socket joint found?
Answers: 2
You know the right answer?
Questions in other subjects:


