
Biology, 17.10.2021 07:30 Justinoreilly71
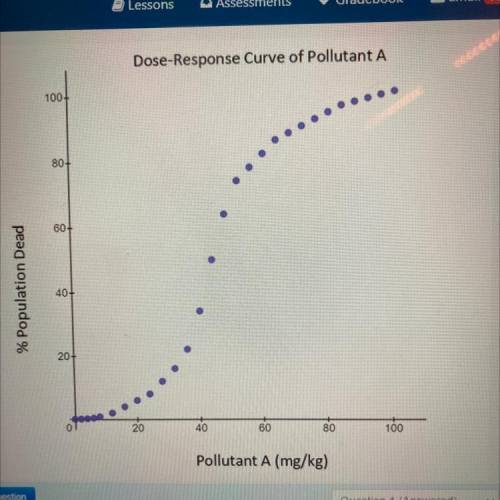
The curve below shows the percentage of population of aquatic species that die in response to doses of pollutant A:
(REEFER TO CURVE)
A local manufacturing plant reports a spill that released pollutant A into the local watershed. Pollutant A is a toxic substance. Local officials must determine if the residents should be evacuated from the area. Initial groundwater samples show pollutant levels at 5 mg/kg of water. Which decision is supported by the empirical evidence provided by the dose-response curve?
A)Evacuation is not needed; continue groundwater monitoring.
B)Residents should be evacuated until levels decrease.
C)The spill no longer needs monitoring.
D)Residents should only evacuate above LD50

Answers: 3


Other questions on the subject: Biology
Biology, 22.06.2019 20:00, sanchez626
When you aware sick your body produces more leukocytes. briefly describe where the leukocyte are formed, how they are transported, and where they may be stored.
Answers: 1
Biology, 23.06.2019 00:00, shancaines17
Which table best shows the impacts resulting from human activity? impact of human activities human activity impact use of manure and other organic fertilizers reduction in population of birds use of pesticides in farms increase in bird population in nearby wetlands impact of human activities human activity impact use of manure and other organic fertilizers reduction in animal population use of pesticides in farms increase in population of native insects and bugs impact of human activities human activity impact use of plastic decrease in marine animal population removal of beach grass increase in pollution of ocean impact of human activities human activity impact use of plastic increase in fish population removal of beach grass decrease in sand erosion
Answers: 1
You know the right answer?
The curve below shows the percentage of population of aquatic species that die in response to doses...
Questions in other subjects:


Mathematics, 04.06.2020 14:06

Chemistry, 04.06.2020 14:06


