
HELP
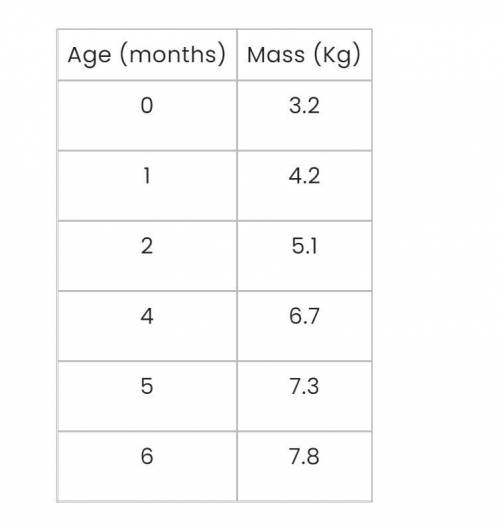
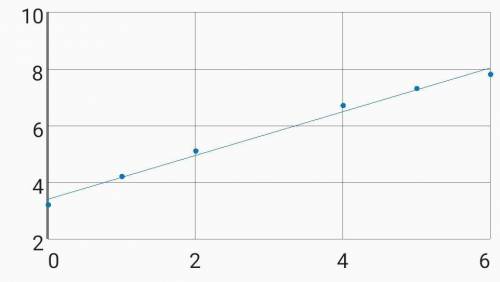
1. A baby’s mass was measured when the baby was born and then every month for 6 months. At 3 months of age, the baby was sick, so the baby’s mass was not measured. Create a graph by using the data table above. Use the graph to find the likely mass of the baby at 3 months.
2. Does your graph show a linear or a nonlinear relationship? Explain your answer.

Answers: 1


Other questions on the subject: Biology
Biology, 21.06.2019 16:30, romeojose2005
Dna is always read in the whereas rna is read in .
Answers: 2
Biology, 22.06.2019 15:50, caroline1484
What happens to the average kinetic energy of water molecules as water freezes?
Answers: 1
You know the right answer?
HELP
1. A baby’s mass was measured when the baby was born and then every month for 6 months. At 3...
Questions in other subjects:


Mathematics, 28.09.2020 23:01
Mathematics, 28.09.2020 23:01


Geography, 28.09.2020 23:01
English, 28.09.2020 23:01

History, 28.09.2020 23:01

Chemistry, 28.09.2020 23:01


