
Populations Lab Report
Instructions: The Virtual Populations Lab is on the lesson assessment page. Gather data to evaluate Sebastian’s Snorkel Spot’s claim that a new factory is polluting the coral reef. Follow the instructions as you move through the lab and record your data and observations in the lab report.
Title:
Objective(s):
Hypothesis:
Variables:
Procedure
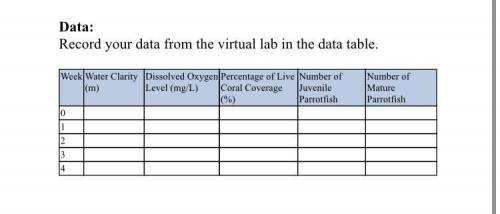
During the research phase, you found that the factory is not using nutrient-removal treatment on the water it releases. Excess nutrients in the water encourage algae growth, which can smother coral. To monitor the water quality and health of the coral reef, you will collect data on five factors: water clarity, dissolved oxygen levels, percentage of live coral coverage, number of juvenile parrot fish observed, and number of mature parrotfish observed.
Data:
Record your data from the virtual lab in the data
Data Analysis:
Select one abiotic factor that was monitored, either water clarity or dissolved oxygen level, and create a line graph showing the measurement of the abiotic factor over time. Then select one biotic factor that was monitored, either coral coverage, juvenile parrotfish, or mature parrotfish, and create a line graph showing the measurement of the biotic factor over time.
Insert Chart [Hint: don’t forget to create a line graph to analyze your data]
Conclusion:
Be sure to answer the following reflection questions as a summary in the conclusion of your lab report:
• Was your hypothesis correct? Why or why not? Be sure to include evidence from the data you collected to support your conclusion.
• Based on your data, describe the overall trend for each of the five factors that were measured?
• What information do your graphs show? Describe the correlation between the two factors that you graphed
Questions:
Using what you have learned in the lesson and the virtual lab activity, answer the following questions in complete sentences.
1. Identify the abiotic and biotic factors in this lab.
2. Describe the symbiotic relationship between each of the organisms.
3. Explain how the limiting factors affect carrying capacity in each population.

Answers: 2


Other questions on the subject: Biology
Biology, 22.06.2019 14:00, dakshshberry
Which tool could you see a plant cell? a. a filter b. a microscope c. a microwave d. an electromagnet
Answers: 1
Biology, 22.06.2019 16:00, QueenNerdy889
Where is having brightly colored feathers that attract mates most clearly an adaptation for a bird? a. a forest with dense vegetation b. a sandy beach beside an ocean c. a snowy tundra with little vegetation d. a swamp with many hawks that eat birds
Answers: 1
Biology, 22.06.2019 21:00, ddaaaeeee2960
Amoeba proteus is injected with a drug that inhibits the formation of microtubules. what effect does this have on the organism’s movement?
Answers: 2
You know the right answer?
Populations Lab Report
Instructions: The Virtual Populations Lab is on the lesson assessment page....
Questions in other subjects:

Mathematics, 18.02.2021 01:50
Mathematics, 18.02.2021 01:50
Mathematics, 18.02.2021 01:50
Mathematics, 18.02.2021 01:50
Mathematics, 18.02.2021 01:50
Mathematics, 18.02.2021 01:50


