
Biology, 25.08.2021 05:30 bellagvjh1760
HELP!!
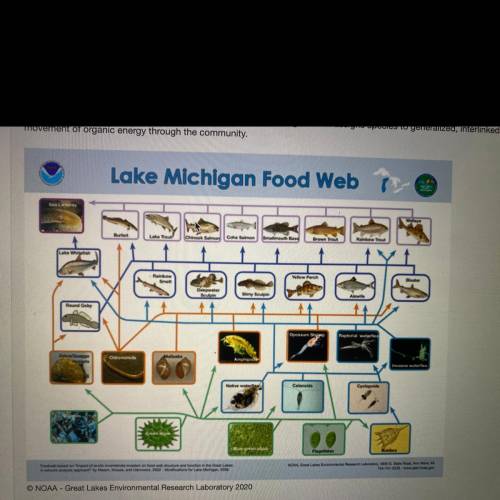
a. Consider how energy transfers between trophic levels in the above diagram. A scientist wants determine how much Yellow Perch relies on Opossum Shrimp in a lake as a food source. They first isolate a small group of Yellow Perch from the pond.
i. Identify a reasonable hypothesis that would help guide the scientist to their answer.
il. Identify the dependent variable in your proposed hypothesis.
ill. Explain how the results of the experiment might be affected by other influences in the ecosystem.
b. Use the food web to identify the following:
1. Identify the trophic level represented by green algae, blue-green algae, and flagellates.
il. Identify three species that are intermediate predators (secondary or tertiary consumers) in the marine food web,
i. Describe the effects of removing the green algae species from the marine food web in Lake Michigan.
c. Energy transfers between trophic levels:
1. Green algae produces 1,000 grams of biomass, which represents usable chemical energy. Describe the approximate amount of energy from that biomass that will
transfer from green algae to the native water fleas in the food web.
ii. Explain why energy is lost moving from a lower trophic level to a higher trophic level.

Answers: 1


Other questions on the subject: Biology
Biology, 22.06.2019 03:00, ghkfkhgm859
Radiometric dating is used to tell the absolute age of materials by studying the decay rate of radioactive isotopes. the decay rates of isotopes are constant and are expressed as .
Answers: 1
Biology, 22.06.2019 03:30, crispingolfer7082
State officials are considering constructing a road through a forested wilderness area. this action will likely affect the forest ecosystem in various ways. part a: predict how the construction of a road could negatively affect plants and animals in that ecosystem. (3 points) part b: describe one way that the construction of a road could have a positive impact of the forest ecosystem. (1 point)
Answers: 1
Biology, 22.06.2019 05:30, awesome266
This map shows how climate change might affect precipitation patterns in the great plains of the united states by the end of this century. brown shoes a decrease in percipitation, and blue shows an increase. the maps differ based on the predictive levels of green house emissions. the maps shows that northern area should get a. more pracipations regardless of emmissions b. less pracipation, regardless of emmissions levels c. more precipitation, but only when emission levels. southern areas show a. more pracipations regardless of emmissions b. less pracipation, regardless of emmissions levels c. more precipitation, but only when emission levels. to use these maps to prepare for natural disasters in the great plains, scientist need to ask? a. how many tons of emissions were used at the basis of the map. b. which types of fossil fuels are used in the great plains c. if you think the above is wrong it's probly c the question is cut off
Answers: 1
You know the right answer?
HELP!!
a. Consider how energy transfers between trophic levels in the above diagram. A scientist w...
Questions in other subjects:


English, 07.05.2020 07:58
Mathematics, 07.05.2020 07:58
Mathematics, 07.05.2020 07:58

Spanish, 07.05.2020 07:58


