
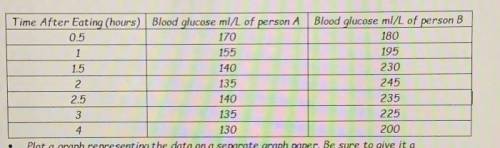
Plot a graph representing the data on a separate graph paper. Be sure to give it a
title, correct X and Y axis with correct variables and scales, and legend.
What is the dependent variable and why?
What is the independent variable and why?
What title would you give the graph?
Which, if any, of the above individuals (A or B) has diabetes?
What data do you have to support your hypothesis?
If the time period were extended to 6 hours, what would be the expected blood
glucose level for Person B?
What is the mode, range, mean median, standard deviation, and standard error
of the mean for each Person? Show your work.

Answers: 1


Other questions on the subject: Biology
Biology, 22.06.2019 07:30, jsjsjsskakwkowwj
The arrows indicate the direction of wind flow. which place experiences monsoons?
Answers: 1
Biology, 22.06.2019 14:20, Blahdjwj108
Which feature would you expect to find in a population in which sexual selection depends on male competition?
Answers: 1
Biology, 22.06.2019 16:30, kraigstlistt
How do disease caused by bacteria and disease caused by viruses react to antibiotics
Answers: 2
You know the right answer?
Plot a graph representing the data on a separate graph paper. Be sure to give it a
title, correct X...
Questions in other subjects:


Mathematics, 06.01.2021 18:50
Mathematics, 06.01.2021 18:50

Business, 06.01.2021 18:50
Mathematics, 06.01.2021 18:50


