
Biology, 11.06.2021 18:10 Awesomedude1157
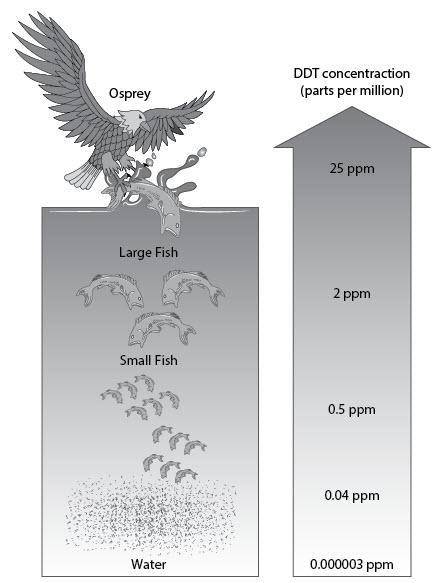
The illustration shows an ocean food chain and the concentrations of the toxin DDT at each trophic level. What conclusions can be made as to how DDT impacts this food chain? Include where the concentration of DDT is likely to be lowest, and where it is likely to be highest.

Answers: 2


Other questions on the subject: Biology
Biology, 22.06.2019 09:00, faizanaj1192
When a gasoline engine burns gasoline, what type of chemical reaction is occurring?
Answers: 1
Biology, 22.06.2019 14:00, mariana5493
What will happen if two of the base pairs of the stand of the dna are switched
Answers: 1
Biology, 22.06.2019 17:50, radcon8099
Babies with very low or very high birth weight are less likely to survive. observe a graph of the data. me % babies born at different weights - babies born in that category which statement is a valid claim that could be made using the data in the graph? directional selection is occurring because the graph favors an extreme. mark this and totum save and exit next submit type here to search
Answers: 2
You know the right answer?
The illustration shows an ocean food chain and the concentrations of the toxin DDT at each trophic l...
Questions in other subjects:


Mathematics, 30.11.2021 03:30


Mathematics, 30.11.2021 03:30


