
Biology, 21.05.2021 21:30 billyeyelash
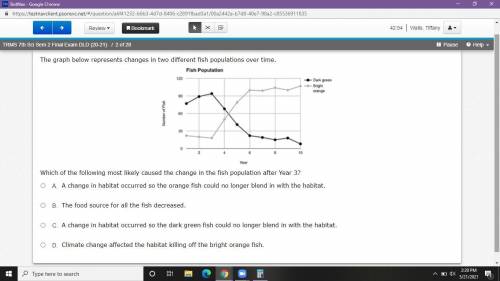
Screenshot 1. The graph below represents changes in two different fish populations over time.
Which of the following most likely caused the change in the fish population after Year 3?
A. A change in habitat occurred so the orange fish could no longer blend in with the habitat.
B. The food source for all the fish decreased.
C .A change in habitat occurred so the dark green fish could no longer blend in with the habitat.
D. Climate change affected the habitat killing off the bright orange fish.
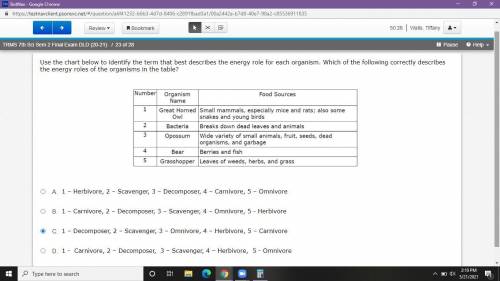
Screenshot 2. Use the chart below to identify the term that best describes the energy role for each organism. Which of the following correctly describes the energy roles of the organisms in the table?
A. 1 – Herbivore, 2 – Scavenger, 3 – Decomposer, 4 – Carnivore, 5 – Omnivore
B. 1 – Carnivore, 2 – Decomposer, 3 – Scavenger, 4 – Omnivore, 5 - Herbivore
C. 1 – Decomposer, 2 – Scavenger, 3 – Omnivore, 4 – Herbivore, 5 – Carnivore
D. 1 - Carnivore, 2 – Decomposer, 3 – Scavenger, 4 – Herbivore, 5 - Omnivore

Answers: 2


Other questions on the subject: Biology
Biology, 22.06.2019 02:00, harleycochran2ovyt3n
Name the two stages involved in protein synthesis and explain what occurs in each of the two stages. be sure to also indicate where each process takes place. plz don't give one sentence answers : d
Answers: 2
Biology, 22.06.2019 05:30, stricklandjoseph12
Which of the following is a good strategy when it comes to desserts
Answers: 3
You know the right answer?
Screenshot 1. The graph below represents changes in two different fish populations over time.
Which...
Questions in other subjects:

Mathematics, 25.02.2021 23:20

Social Studies, 25.02.2021 23:20

English, 25.02.2021 23:20
Mathematics, 25.02.2021 23:20


