
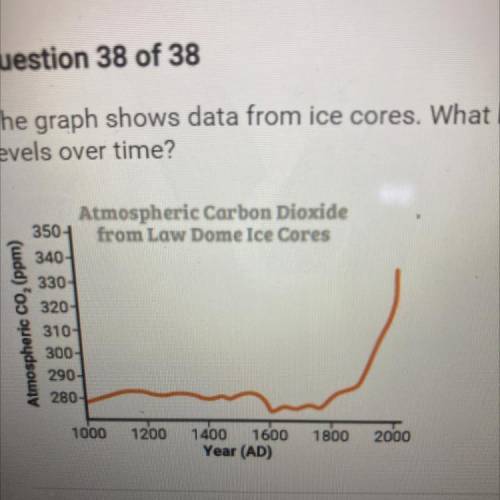
The graph shows data from ice cores. What has happened to carbon dioxide levels over time?
A. They have increased dramatically recently.
B. They have remained flat and steady.
C. They have decreased dramatically recently.
D. They have gone up and down with no general trend.

Answers: 2


Other questions on the subject: Biology
Biology, 22.06.2019 05:30, carlydays3331
What in scientific term why the salty popcorn causes this thirst
Answers: 1
Biology, 22.06.2019 19:10, isabellawest2
which is an effect of short-term environmental changes? a) adaptation b) speciation c) extinction d) death (5 points)
Answers: 1
Biology, 22.06.2019 23:00, discolldiane3708
The human genome consist of about chemical letters
Answers: 2
You know the right answer?
The graph shows data from ice cores. What has happened to carbon dioxide levels over time?
A. They...
Questions in other subjects:
Biology, 14.01.2020 13:31

English, 14.01.2020 13:31

History, 14.01.2020 13:31


Health, 14.01.2020 13:31
History, 14.01.2020 13:31
Mathematics, 14.01.2020 13:31


