100

Biology, 17.05.2021 21:20 montgomerykarloxc24x
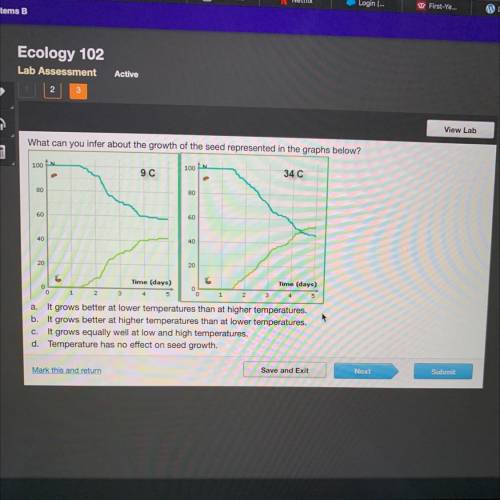
What can you infer about the growth of the seed represented in the graphs below?
100 N
100
9 C
34 C
>
80
80
60
60
40
40
20
20
0
0
0
1
2
3
4
5
2
3
Time (days)
Time (days)
1
4 5
a. It grows better at lower temperatures than at higher temperatures.
b. It grows better at higher temperatures than at lower temperatures.
c. It grows equally well at low and high temperatures.
d. Temperature has no effect on seed growth.

Answers: 2


Other questions on the subject: Biology
Biology, 21.06.2019 19:30, tynasiaparks13
What kind of seafood would you expect to have the highest levels of mercury and why? kelp, because they use the sun to photosynthesize on the bottom trophic level. oysters, because they filter feed on plankton on a lower trophic level. small fish, because they eat plankton on a higher trophic level. sharks, because they feed on organisms on a higher trophic level.
Answers: 1
Biology, 22.06.2019 05:30, awesome266
This map shows how climate change might affect precipitation patterns in the great plains of the united states by the end of this century. brown shoes a decrease in percipitation, and blue shows an increase. the maps differ based on the predictive levels of green house emissions. the maps shows that northern area should get a. more pracipations regardless of emmissions b. less pracipation, regardless of emmissions levels c. more precipitation, but only when emission levels. southern areas show a. more pracipations regardless of emmissions b. less pracipation, regardless of emmissions levels c. more precipitation, but only when emission levels. to use these maps to prepare for natural disasters in the great plains, scientist need to ask? a. how many tons of emissions were used at the basis of the map. b. which types of fossil fuels are used in the great plains c. if you think the above is wrong it's probly c the question is cut off
Answers: 1
Biology, 22.06.2019 09:30, shady1095
Antoine manages a number of apartment buildings that use natural gas for heating, cooking, and laundry. the scatter plot shows the correlation between the outside air temperature and antoine's natural gas bill. which type of correlation does the plot illustrate?
Answers: 2
You know the right answer?
What can you infer about the growth of the seed represented in the graphs below?
100 N
100
100
Questions in other subjects:

Biology, 04.05.2020 23:26

English, 04.05.2020 23:26
Mathematics, 04.05.2020 23:26
Mathematics, 04.05.2020 23:26


Advanced Placement (AP), 04.05.2020 23:26


