Pls help! 20 points
This graph compares growth measures and emissions between 1980 and 2014.
...

Biology, 17.05.2021 16:00 theyycraveenaee
Pls help! 20 points
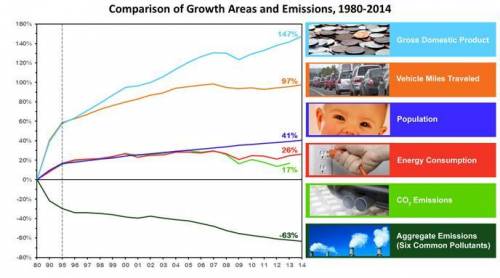
This graph compares growth measures and emissions between 1980 and 2014.
The graph labeled __ shows that pollution control methods are having a positive effect in the United States. The proof is trend ___ in this graph, with the percentage drop over this period reaching ___%.
First blank options:
A. aggregate emissions
B. energy consumption
C. population
D. vehicle miles traveled
Second blank options:
A. a decreasing
B. an increasing
C. an unchanging
Third blank options:
A. -63
B. 0
C. 17
D. 147

Answers: 3


Other questions on the subject: Biology
Biology, 21.06.2019 20:00, shikiaanthony
Here's one way to follow the scientific method. place the missing steps in the correct position in the process.
Answers: 3
Biology, 22.06.2019 00:30, ijustneedhelp29
Which element forms the basis of all organic organisms a carbon b oxygen c hydrogen d nitrogen
Answers: 2
Biology, 22.06.2019 01:00, Samuelgamboe
The sketch shows a rynchosaur, an extinct animal that is known only from fossils. there has been much debate about the classification of these creatures. some scientists suggest that they belong with primitive amphibians, and some think they are related to snakes and lizards. the data equally support both cases. which statement best explains how to draw a cladogram that includes the rynchosaur? draw the cladogram for amphibians. draw the cladogram for reptiles. draw two cladograms, both showing the traits, and leave it as a hypothesis. draw two cladograms, both showing the traits, and have scientists vote
Answers: 2
Biology, 22.06.2019 02:00, aredding7016
The accompanying figure shows the percent of selected dna sequences that match between a chimpanzee and other primates. these data support the hypothesis that the figure shows the percentage of selected d n a sequences that match between the chimpanzee and other primates. the human has an almost 98 percent match, the gorilla has an almost 97 percent match, the orangutan has a 96 percent match, the gibbon has an almost 95 percent match, and the old world monkey has an almost 92 percent match. the accompanying figure shows the percent of selected dna sequences that match between a chimpanzee and other primates. these data support the hypothesis that the figure shows the percentage of selected d n a sequences that match between the chimpanzee and other primates. the human has an almost 98 percent match, the gorilla has an almost 97 percent match, the orangutan has a 96 percent match, the gibbon has an almost 95 percent match, and the old world monkey has an almost 92 percent match. chimpanzees and gibbons are the most closely related the chimpanzee's closest surviving relative is humans orangutans are the primates least closely related to chimpanzees old world monkeys and gibbons are the most closely related
Answers: 1
You know the right answer?
Questions in other subjects:

Mathematics, 16.09.2020 05:01
Mathematics, 16.09.2020 05:01

Chemistry, 16.09.2020 05:01
Mathematics, 16.09.2020 05:01
Mathematics, 16.09.2020 05:01
Mathematics, 16.09.2020 05:01
Mathematics, 16.09.2020 05:01
Mathematics, 16.09.2020 05:01
Mathematics, 16.09.2020 05:01
Mathematics, 16.09.2020 05:01


